2
$\begingroup$

I am reading the article "Visualization of Riemann Surfaces of Algebraic Functions" by Michael Trott, and I couldn't run an important expression. He wrote

The following picture shows all four sheets of the imaginary part (we omit the polygons from the third quadrant to have a better look at the inner parts) of the function $w^4=1-z^4$.

rsf = With[{ε = 1/10^12}, 
   Show[Function[f, 
      Apply[Plot3D[Re[f], {x, #1, #2}, {y, #3, #4}, PlotPoints -> 17, 
         DisplayFunction -> Identity] &, {{ε, 
         2, ε, 
         2}, {-ε, -2, ε, 
         2}, {-ε, -2, -ε, -2}}, {1}]] /@ 
{Sqrt[1 - (x + I y)^4], -Sqrt[1 - (x + I y)^4], 
      I Sqrt[1 - (x + I y)^4], -I Sqrt[1 - (x + I y)^4]}, 
    DisplayFunction -> $DisplayFunction, BoxRatios -> {1, 1, 1}, 
    ViewPoint -> {4, -2, 1.7}]]

For Riemann surfaces with more than two or three sheets, we typically encounter the problem that it is hard to look inside. To have a better look in the inner parts of the surface, we define a function holePolygon which cuts a hole of size f in a polygon.

holePolygon[Polygon[l_], f_] := 
 Module[{m = Plus @@ l/Length[l], innerPoints}, 
  innerPoints = (m + f (#1 - m) &) /@ l; {MapThread[
    Polygon[Join[#1, 
       Reverse[#2]]] &, {Partition[(Append[#1, First[#1]] &)[l], 2, 
      1], Partition[(Append[#1, First[#1]] &)[innerPoints], 2, 
      1]}], (Line[Append[#1, First[#1]]] &)[innerPoints]}]

The following picture shows the previous Riemann surface with holed polygons:

Show[Graphics3D[{EdgeForm[], Thickness[0.0001], 
    SurfaceColor[Hue[0.8199999999999999], Hue[0.22], 
     1.209999999999999], 
    Cases[rsf, _Polygon, ∞] /. 
    p_Polygon :> holePolygon[p, 0.8]}], 
  BoxRatios -> {1, 1, 1.399999999999999}, ViewPoint -> {4, -2, 1.7}]

When I run the last piece Mathematica returns

"Coordinate...should be a triple of numbers, or a Scaled form".

Someone has any idea why is it happens?

$\endgroup$
1

2 Answers 2

3
$\begingroup$

It's tricky to parse how the holePolygon function works, but I can see what is tripping it up.

In the intervening years since the code was written, Plot3D's output has changed to a GraphicsComplex.

This means that when you do a Cases[ rsf, _Polygon, ∞], you will get things like Polygon[ {{1,2,3,4}, {5,6,7}...}] where the integers are not coordinates but references to coordinates.

Applying a Normal will fix that, but it adds VertexNormals options to the Polygons. Modifying holePolygon to discard any polygon options fixes the issue

holePolygon[Polygon[l_, opts_], f_] := 
 Module[{m = Plus @@ l/Length[l], innerPoints}, 
  innerPoints = (m + f (#1 - m) &) /@ l; {MapThread[
    Polygon[Join[#1, 
       Reverse[#2]]] &, {Partition[(Append[#1, First[#1]] &)[l], 2, 
      1], Partition[(Append[#1, First[#1]] &)[innerPoints], 2, 
      1]}], (Line[Append[#1, First[#1]]] &)[innerPoints]}]

Show[Graphics3D[{EdgeForm[], Thickness[0.0001], 
   SurfaceColor[Hue[0.8199999999999999], Hue[0.22], 
    1.209999999999999], 
   Cases[Normal@rsf, _Polygon, ∞] /. 
    p_Polygon :> holePolygon[p, 0.8]}], 
 BoxRatios -> {1, 1, 1.399999999999999}, ViewPoint -> {4, -2, 1.7}]

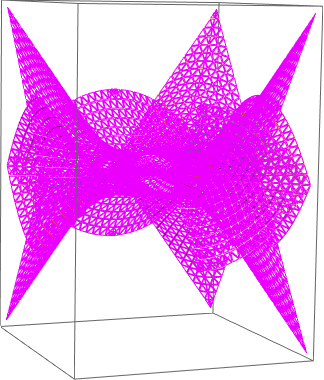
Mathematica graphics

Is that what the plot should look like?

$\endgroup$
4
  • $\begingroup$ I really works but, as he wroten, this plot should increase our understanting about this surface. Looking at this plot I am not sure if it could help. But thanks for your answer anyway. $\endgroup$
    – jon jones
    Commented Sep 15, 2017 at 19:31
  • $\begingroup$ Look this. If you put << Version5`Graphics`​ above all codes run normally. $\endgroup$
    – jon jones
    Commented Sep 15, 2017 at 19:42
  • 1
    $\begingroup$ The quality of the Graphics in V5 isn't the best but at least you can viasualize what Trott was seeing when he wrote this article $\endgroup$
    – jon jones
    Commented Sep 15, 2017 at 19:44
  • $\begingroup$ Another important difference is that Plot3D[] used to return quads, while the current version returns triangles, on top of being a GraphicsComplex[] object that needs to be pre-processed with Normal[] for a polygon substitution such as this. $\endgroup$ Commented Sep 15, 2017 at 22:14
7
$\begingroup$

The reason why Trott resorted to cutting holes in the Riemann surfaces back then is that he wanted to be able to see through the surfaces' internal structure, and this was the most expedient route. However, we now have a directive that Trott didn't have when he wrote his article: Opacity[].

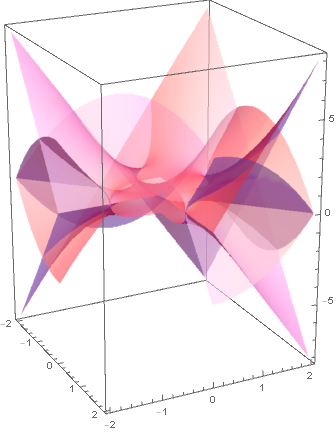
Thus, making the necessary adaptations for the current version, we have:

With[{ε = 1.*^-12}, 
     Show[Function[f, Plot3D[Re[f], {x, #1, #2}, {y, #3, #4}, BoundaryStyle -> None, 
                             Mesh -> False, PlotPoints -> 25, 
                             PlotStyle -> Directive[Opacity[0.6, Hue[0.82]],
                                                    Specularity[Hue[0.22], 1.21]]] & @@@
                   {{ε, 2, ε, 2}, {-ε, -2, ε, 2}, {-ε, -2, -ε, -2}}] /@
          {Sqrt[1 - (x + I y)^4], -Sqrt[1 - (x + I y)^4],
           I Sqrt[1 - (x + I y)^4], -I Sqrt[1 - (x + I y)^4]}, 
          BoxRatios -> {1., 1., 1.4}, PlotRange -> All, ViewPoint -> {4., -2., 1.7}]]

Riemann surface for z^4 + w^4 = 1


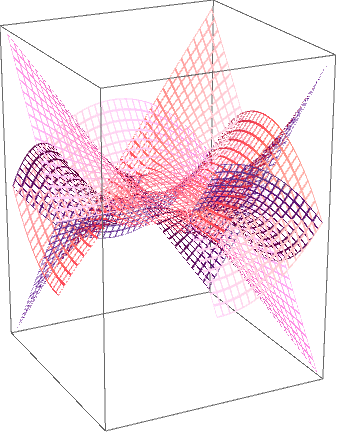
If you insist on adapting the original hole-punching business by Trott to the current version, here's one way to do it. I will use a slight modification of Heike's implementation of PerforatePolygons[] here to punch the holes:

perforateaux[pts_, ratio_, indices : {__Integer}] :=
Module[{vertices, center, newPts, ind}, 
       vertices = Replace[indices, {{p_, b___, p_} :> {p, b}}];
       center = Mean[pts[[vertices]]];
       newPts = ratio (# - center) + center & /@ pts[[vertices]];
       ind = MapThread[Flatten[{#1, Reverse[#2]}] &,
                       {Partition[vertices, 2, 1, 1],
                        Partition[Range[Length[newPts]] + Length[pts], 2, 1, 1]}];
       {Join[pts, newPts], ind}];

perforateaux[pts_, ratio_, indices : {{__Integer} ..}] :=
{#[[1]], Flatten[#[[2, 1]], 1]} & @
Reap[Fold[(Sow[#2]; #1) & @@ perforateaux[#, ratio, #2] &, pts, indices]]

PerforatePolygons[graphics3D_, ratio_: 0.8] := graphics3D /. 
         GraphicsComplex[pts_, shape_, opt___] :> Module[{dir, newshapes},
         newshapes = Flatten[Cases[{shape}, Polygon[a_, b___] :>
                                   (If[Depth[a] == 2, {a}, a]), ∞], 1];
         dir = DeleteCases[{shape}, Polygon[a_, b___], ∞];
         GraphicsComplex[#1, Flatten[{dir, Polygon[#2]}]] & @@ 
         perforateaux[pts, ratio, newshapes, opt]]

Now, for the surface itself:

(* for generating a mesh just like old Mathematica did *)
MakePolygons[vl_ /; ArrayQ[vl, 3]] := Module[{dims = Most[Dimensions[vl]]}, 
    GraphicsComplex[Apply[Join, vl], 
                    Polygon[Flatten[Apply[Join[#1, Reverse[#2]] &, 
                                          Partition[Partition[Range[Times @@ dims],
                                                              Last[dims]],
                                                    {2, 2}, {1, 1}], {2}], 1]]]]

With[{ε = 1.*^-12, n = 17}, 
     PerforatePolygons[Graphics3D[Function[f, 
     MapAt[Function[p, {Directive[EdgeForm[], Hue[0.82],
                                  Specularity[Hue[0.22], 1.21]], p}], 
           MakePolygons[Table[{x, y, Re[f]},
                              {x, #1, #2, (#2 - #1)/(n - 1)},
                              {y, #3, #4, (#4 - #3)/(n - 1)}]], 2] & @@@
     {{ε, 2, ε, 2}, {-ε, -2, ε, 2}, {-ε, -2, -ε, -2}}] /@
     {Sqrt[1 - (x + I y)^4], -Sqrt[1 - (x + I y)^4], 
      I Sqrt[1 - (x + I y)^4], -I Sqrt[1 - (x + I y)^4]}, 
     BoxRatios -> {1., 1., 1.4}, PlotRange -> All, ViewPoint -> {4., -2., 1.7}]]]

Riemann surface for z^4 + w^4 = 1, with holes

$\endgroup$
1
  • 1
    $\begingroup$ Very nice! The opacity is a great touch $\endgroup$
    – Jason B.
    Commented Sep 17, 2017 at 2:02

Your Answer

By clicking “Post Your Answer”, you agree to our terms of service and acknowledge you have read our privacy policy.

Not the answer you're looking for? Browse other questions tagged or ask your own question.