3
$\begingroup$

I'm trying to plot a probability function that has large fractions between 0 and 1, but Plot returns an empty graph.

The strange thing is that when I adjust the sampling using the output slider or adjust the line thickness, I can briefly see the graph before it goes away once I let go.

I'm currently on version 11.0.

Here's my code:

func[x_] := 365!/((365 - x)! 365^x)
Plot[func[x], {x, 0, 100}]

I've also tried defining func[x_] as N[...] (calculating the numerical value), but that makes no difference.

$\endgroup$
4
  • $\begingroup$ I don't know how to fix this, but if all you care about is how the function looks like you can get around the problem by explicitly evaluating it for a list of values: ListLinePlot[Table[{x, func[x]}, {x, 100}]] $\endgroup$
    – yohbs
    Commented Apr 27, 2017 at 2:50
  • $\begingroup$ @yohbs That's okay for now, but I noticed this problem with several other functions involving really large or tiny numbers (can't recall them right now). I'm wondering if this is a bug or not. $\endgroup$
    – jLee
    Commented Apr 27, 2017 at 3:33
  • $\begingroup$ @jLee I get a plot using your code on MMA 11.1.0 . $\endgroup$ Commented Apr 27, 2017 at 4:11
  • $\begingroup$ @jLee I get a plot using $Version "11.1.0 for Mac OS X x86 (64-bit) (March 16, 2017)" $\endgroup$
    – evanb
    Commented Apr 27, 2017 at 6:03

3 Answers 3

1
$\begingroup$

For functions that might not work directly even on 64-bit machines, you might consider the old-fashioned way using logs:

func[x_] := Exp[LogGamma[365 + 1] - LogGamma[365 - x + 1] - x Log[365]]
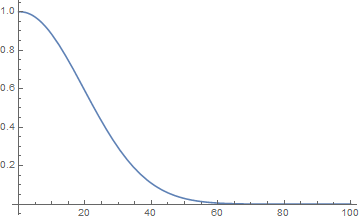
Plot[func[x], {x, 0, 100}]

Function plot

$\endgroup$
0
$\begingroup$

Use FactorialPower[] instead to sidestep any possible overflow issues:

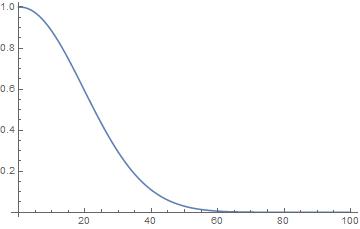
Plot[FactorialPower[365, x] 365^-x, {x, 0, 100}]

function plot

$\endgroup$
0
$\begingroup$

Comment

I am facing the same issue of seeing an empty plot.

"11.0.1 for Microsoft Windows (32-bit)"

Another alternative is to use DiscretePlot,

func[x_] := 365!/((365 - x)!* 365^x);

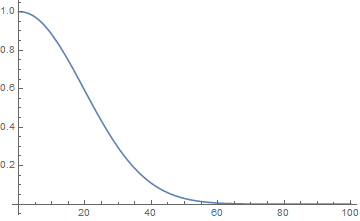
DiscretePlot[func[x], {x, 0, 100}, Filling -> None, Joined -> True]

plot

$\endgroup$
3
  • 1
    $\begingroup$ Perhaps your issue is that you are on a 32-bit OS. On a Mac OS X x86 (64-bit) I have no problem. $\endgroup$
    – Bob Hanlon
    Commented Apr 27, 2017 at 6:01
  • $\begingroup$ @BobHanlon Maybe that is the case. $\endgroup$
    – zhk
    Commented Apr 27, 2017 at 6:05
  • $\begingroup$ @BobHanlon that may be the case since I ran it on my 64 bit Mac OS X machine and it worked, but not my 32 bit Windows machine $\endgroup$
    – jLee
    Commented May 2, 2017 at 15:59

Your Answer

By clicking “Post Your Answer”, you agree to our terms of service and acknowledge you have read our privacy policy.

Not the answer you're looking for? Browse other questions tagged or ask your own question.