I'm new to Mathematica and I'm using it to study graph theory and network data processing and analysis. I recently started to deal with graph data visualization and directed graphs. Which lead me to the wonder about ways of presenting directed graphs.
Lets suppose the following graph:
vlist = {1, 2, 3, 4, 5}
vrules = {1 -> 2, 1 -> 3, 1 -> 5, 2 -> 1, 2 -> 4, 2 -> 5, 3 -> 2, 4 -> 1, 4 -> 5, 5 -> 3, 5 -> 4}
g=Graph[vlist,vrules]
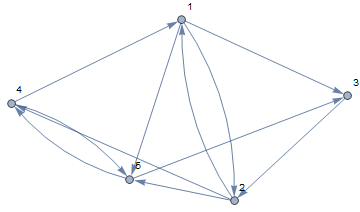
Which is rendered as follows:
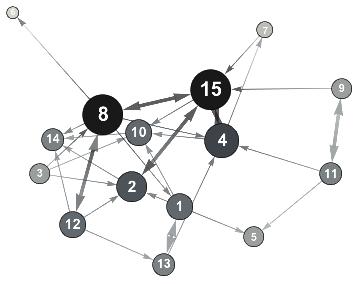
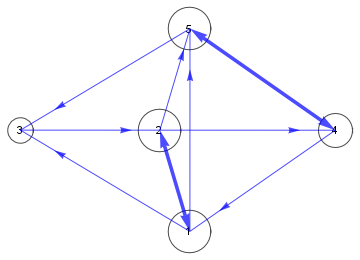
Now I want to make bidirectional connections to be presented as a thick line with arrowheads in both ends, single direction connections to be presented with a thin line and the arrowhead indicating its direction.
I also want the vertices to reflect the centrality of the nodes, so nodes with higher centrality would be presented bigger in proportion to its centrality up to a maximum size.
Fo example, the betweeness and degree centralities of this graph are:
BetweennessCentrality[g]
{2., 3.5, 1., 1., 1.5}

DegreeCentrality[g]
{5, 5, 3, 4, 5}
I've looked into the documentation but didn't find much insight on how to do this kind of stuff, I know that I essentially have to deal with GraphStyle options, but most of them are either poorly documented or not documented at all.
Regards and thanks in advance,


4 -> 5and5 -> 4as edges, instead use4 <-> 5$\endgroup$@Jason B., Thanks for your reply, it would be a very helful helpful option, but only address 1/3 of the problem. $\endgroup$