0
$\begingroup$

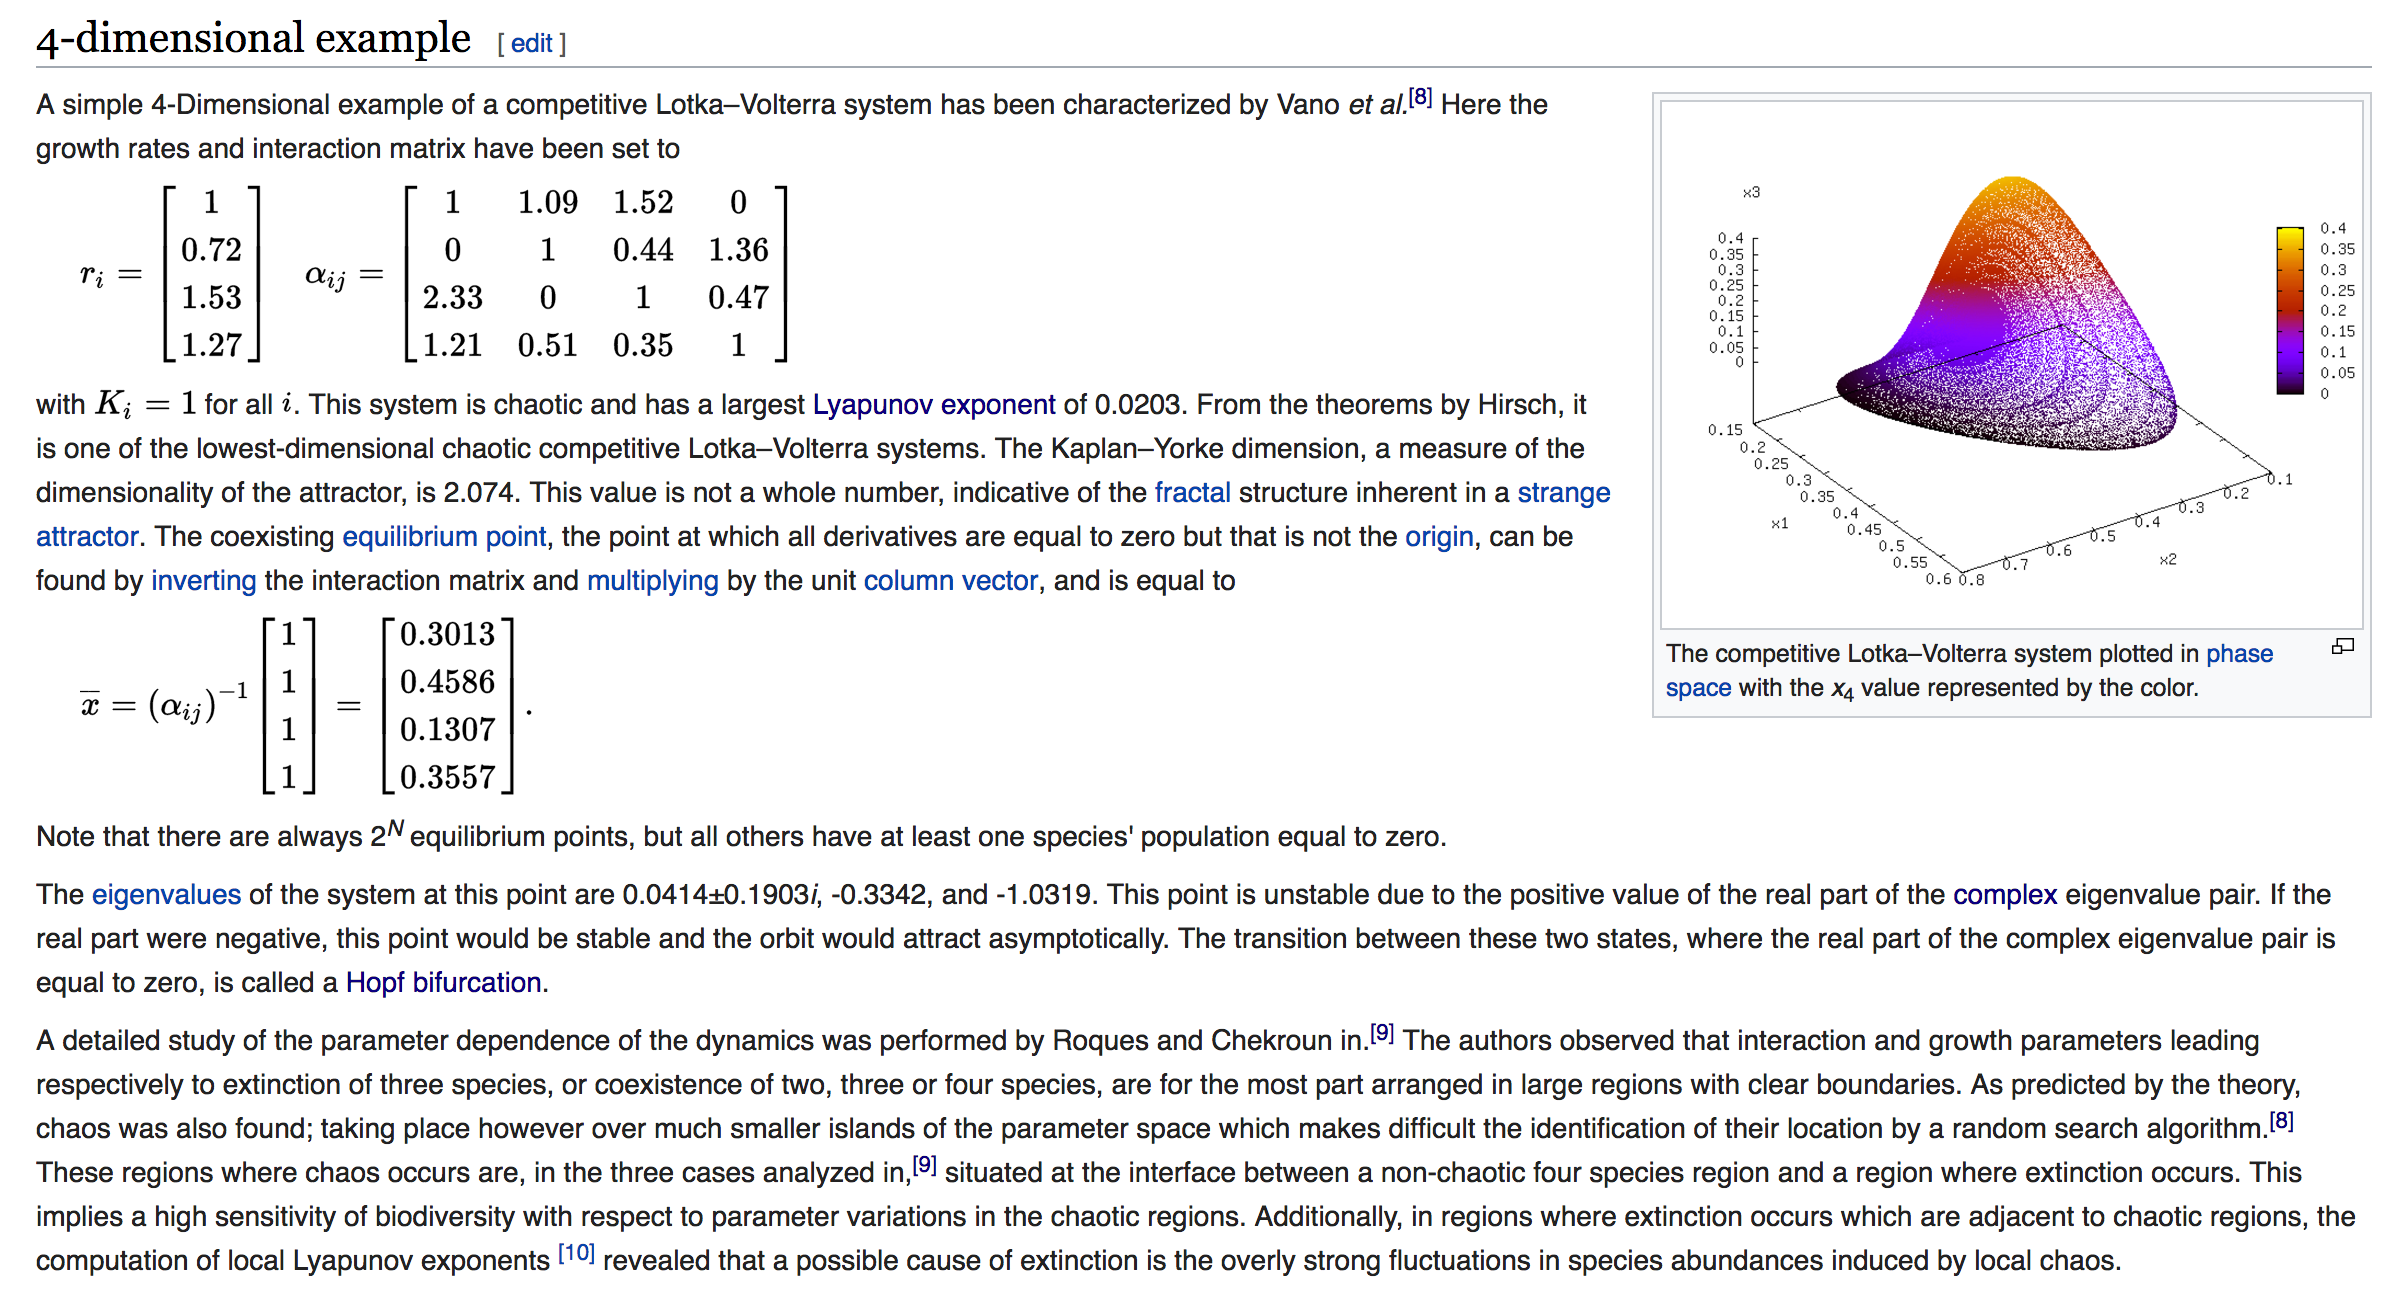
I was referring to the question I posted earlier in Mathematics forum, but then I came to see this example on Wikipedia. How did they plot the system in phase space?

enter image description here

The closet relevant topic I have done is the Lorenz Equation, where I used NDSolve and then ParametricPlot3D evaluated at the fix points.

$\endgroup$
6
  • $\begingroup$ It would be very helpful if you can at least include the setup of the equations you've setup. $\endgroup$
    – Pillsy
    Commented Apr 17, 2017 at 19:16
  • $\begingroup$ @Pillsy Hi, I am trying to model $\frac{dx_i}{dt}=r_ix_i\left(1-\sum_{j=1}^{N}a_{ij}x_j\right)$, but I have only been using Mathematica more than a month. What commend should I be using? $\endgroup$
    – Valia
    Commented Apr 17, 2017 at 19:39
  • $\begingroup$ What initial conditions are you using? $\endgroup$
    – Pillsy
    Commented Apr 17, 2017 at 19:40
  • $\begingroup$ @Pillsy Not clear yet. I will be messing around with the parameters as well as the initial conditions to try to simulate the same result in here. But I think I may know the system more if I start from lower dimensions. $\endgroup$
    – Valia
    Commented Apr 17, 2017 at 19:43
  • 1
    $\begingroup$ For future questions, try to include some code so that people don't have to type all the equations, constants, etc. to provide help. Also, folks like to see that the poster has made some efforts themselves. $\endgroup$
    – Chris K
    Commented Apr 18, 2017 at 1:52

1 Answer 1

6
$\begingroup$

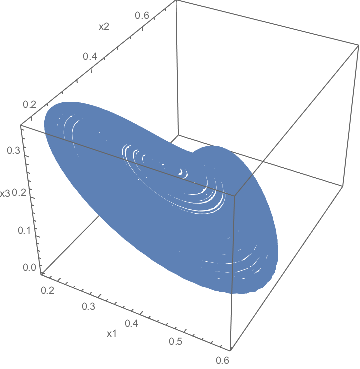
Here's how to numerically solve the model.

nsp = 4;

{r[1], r[2], r[3], r[4]} = {1, 0.72, 1.53, 1.27};
{k[1], k[2], k[3], k[4]} = {1, 1, 1, 1};
amat = {{1, 1.09, 1.52, 0}, {0, 1, 0.44, 1.36}, {2.33, 0, 1, 0.47}, {1.21, 0.51, 0.35, 1}};
Do[a[i, j] = amat[[i, j]], {i, nsp}, {j, nsp}];

eqns = Table[x[i]'[t] ==
  r[i]*x[i][t]*(1 - Sum[a[i, j]*x[j][t]/k[i], {j, nsp}]), {i, nsp}];
ics = Table[x[i][0] == 0.1, {i, nsp}];
unks = Table[x[i], {i, nsp}];

tmax = 10000;
sol = NDSolve[{eqns, ics}, unks, {t, 0, tmax}][[1]];

ParametricPlot3D[Evaluate[{x[1][t], x[2][t], x[3][t]} /. sol], {t, 100, tmax},
  AxesLabel -> {"x1", "x2", "x3"}, PlotPoints -> 200]
Mathematica graphics

I don't know how to color the ParametricPlot3D according to x[4][t] -- that could be an interesting question if it hasn't already been answered on the site.

Update

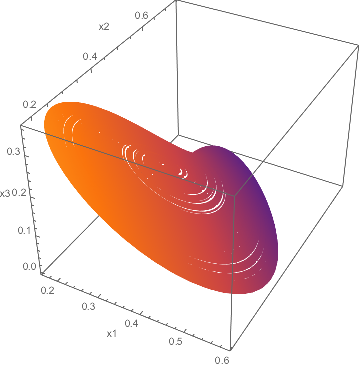
Here's how to color according to x[4][t], using the slot #4 which represents t here:

ParametricPlot3D[Evaluate[{x[1][t], x[2][t], x[3][t]} /. sol], {t, 100, tmax}, 
  AxesLabel -> {"x1", "x2", "x3"}, PlotPoints -> 400, 
  ColorFunction -> (ColorData["SunsetColors", x[4][#4] /. sol] &), 
  ColorFunctionScaling -> False]
Mathematica graphics

$\endgroup$
7
  • $\begingroup$ I'm not particularly pleased with how I set up the a[i,j] terms here. Should be a more elegant way... $\endgroup$
    – Chris K
    Commented Apr 18, 2017 at 2:05
  • 1
    $\begingroup$ I guess something like this: funs = Array[C[#][t] &, 4]; sols = NDSolveValue[Thread[D[funs, t] == {1, 0.72, 1.53, 1.27} funs (1 - {{1, 1.09, 1.52, 0}, {0, 1, 0.44, 1.36}, {2.33, 0, 1, 0.47}, {1.21, 0.51, 0.35, 1}}.funs)] ~Join~ Thread[(funs /. t -> 0) == ConstantArray[1, 4]], Array[C, 4], {t, 0, 1*^4}]; ParametricPlot3D[Evaluate[{sols[[1]][t], sols[[2]][t], sols[[3]][t]}], {t, 100, 1*^4}, AxesLabel -> {"x1", "x2", "x3"}, ColorFunction -> (ColorData["SunsetColors", #3] &), PlotPoints -> 200]. It seems the one who produced the Wiki image ignored the fourth coordinate for coloring. $\endgroup$ Commented Apr 18, 2017 at 2:44
  • $\begingroup$ @J.M. Thanks, it's always interesting to see how other people do things! As for the coloring, it seems that x3 and x4 are highly correlated, which explains why you got a similar looking figure by coloring according to x3. I'm a bit curious how to color according to another function, so might post that as a separate question myself. $\endgroup$
    – Chris K
    Commented Apr 18, 2017 at 13:54
  • $\begingroup$ @Chris K Hi, sorry for bothering you again. With the help yesterday I was able to plot the biomass vs. biodensity. As I am moving to the N-species Lotka-Voltarra, I need to assign random values to $r[i]=$, so instead of saying $r[1]=RandomReal[{0, 1}]$, $r[2]=RandomReal[{0, 1}]$, $r[3]=RandomReal[{0, 1}]$ and so on, is there a commend I can use so that it assigns values to all $r[i]$? I tried using table and array, but my knowledge was too shallow. Also, if $amat$ is a matrix, what does the line $Do[a[i, j] = amat[[i, j]], (i, n), (j, n)]$ do? Thank you so much again! $\endgroup$
    – Valia
    Commented Apr 18, 2017 at 17:15
  • $\begingroup$ @ChrisK Maybe I can sue $r[i] = RandomReal[{0, 10}, {n, 1}] // MatrixForm$ and correspond each row with an i, but how can I do that? $\endgroup$
    – Valia
    Commented Apr 18, 2017 at 17:19

Your Answer

By clicking “Post Your Answer”, you agree to our terms of service and acknowledge you have read our privacy policy.

Not the answer you're looking for? Browse other questions tagged or ask your own question.