1
$\begingroup$

I have a series data

data=Uncompress[
 FromCharacterCode[Flatten[ImageData[Import["https://i.sstatic.net/ApipY.png"], 
    "Byte"]]]];

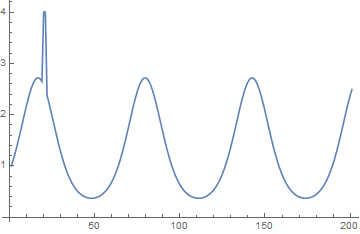
We can show it

ListPlot[data, PlotRange -> All]
Mathematica graphics

I put a singular value in position $20$ and $21$.As I know,wavelet analysis can detect it,but I don't know how to do it.

$\endgroup$

2 Answers 2

1
$\begingroup$

Of course expected more professionnel answer,I just dig in documentation

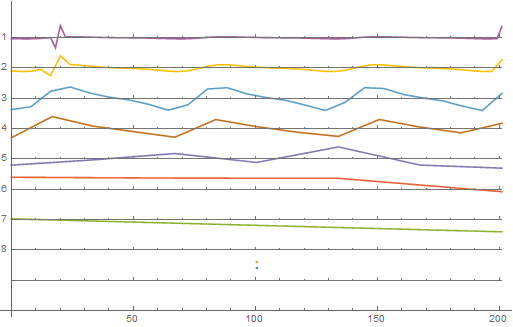
Firstly,plots wavelet transform coefficients

dwd = DiscreteWaveletTransform[data];
WaveletListPlot[dwd]

Mathematica graphics

Select that basis index with minimal energy

{basisIndex} = Keys[MinimalBy[dwd["EnergyFraction"], Last]]

{{0, 1}}

Ugly to extract that x-value.

MaximalBy[
 Cases[basisIndex /. dwd["ListPlot"], a_Line :> a, Infinity][[1,1]], Abs@*Last]

{{20.1, 1.00915}}

$\endgroup$
1
$\begingroup$

Simple way not using wavelet

Position[data - MedianFilter[data, 3], x_ /; x > 1]

{{20}, {21}}

$\endgroup$
2
  • $\begingroup$ Thanks very much,but I have to say,it hard to find that threshold form those difference value $\endgroup$
    – yode
    Commented Sep 18, 2017 at 12:22
  • $\begingroup$ If you don't like picking an amplitude for the threshold, then just pick the Position of the largest (absolute) value of data-MedianFilter. $\endgroup$
    – bill s
    Commented Sep 18, 2017 at 12:31

Your Answer

By clicking “Post Your Answer”, you agree to our terms of service and acknowledge you have read our privacy policy.

Not the answer you're looking for? Browse other questions tagged or ask your own question.