In general, detecting anomalies is pretty straightforward assuming you know the distribution of your data.
In this case, I will estimate the distribution for each dimension in your data, then calculate the probabilities retroactively.
Find Distributions
dataPDFs = Table[
  Block[{dist},
    dist = FindDistribution[data[[All,i]], MaxItems->1];
    PDF[dist,#] &/@ data[[All,i]]
  ]
  ,{i,1,3}]
We have a distribution for each dimension, then plug each value back into the dimensions to find the probability that the value belongs to the distribution.
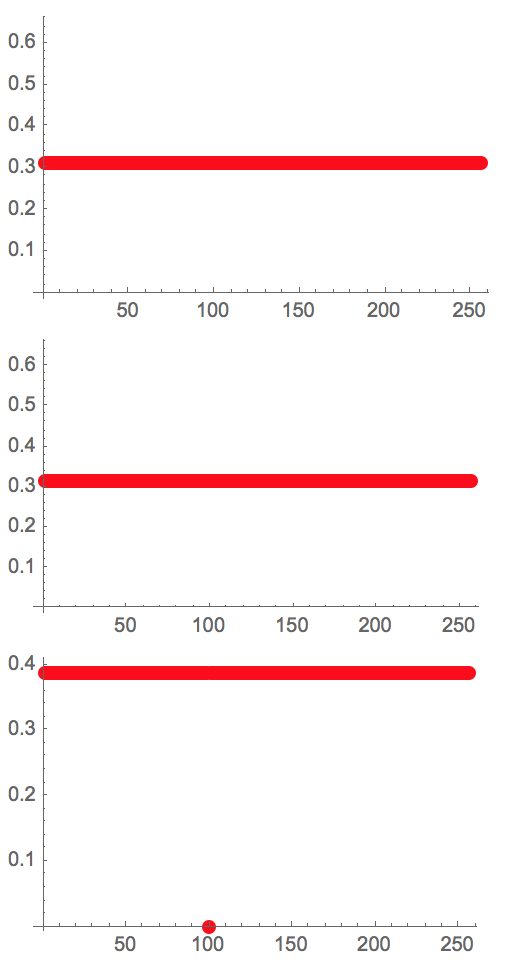
To visualize what we just did:
Column[ListPlot[#, PlotStyle -> {Red, PointSize -> Large}] & /@ dataPDFs]

Outlier is immediately evident.
We can search our results for probabilities less than a given threshold:
Position[dataPDFs, x_ /; x < .01]
(* {{3, 100}} *)
Outlier found in dimension three, position 100


