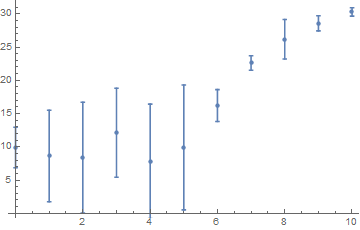
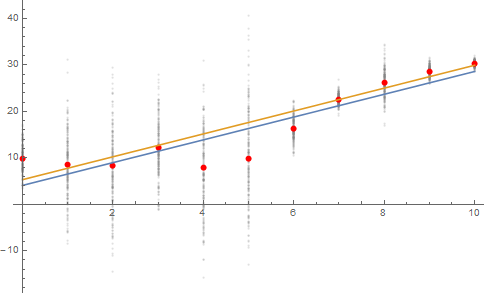
I need to fit data to a line. This data also includes tolerances.
Now, I was wondering, if there exists a method, to account for those tolerances?
For instance, a data point with a lot of tolerances should not be given the same weight as a data point with small tolerances.
Here is a sample of my data:
x| Data-point (y) | +/- tolerance
1| 120.984 | 0.426248
2| 132.194 | 0.418291
3| 130.413 | 1.260100
4| 127.687 | 0.414457
5| 125.710 | 0.410716
6| 128.188 | 1.431200
I was thinking of applying weighted least squares, but I don't know how to implement it.
data = {{1, 120.984}, {2, 132.194}, {3, 130.413}, {4, 127.687}, {5,
    125.710}, {6, 128.188}};
tol = {0.426248, 0.418291, 1.260100, 0.414457, 0.410716, 1.431200};
LinearModelFit[data, x, x, Weights -> 1/tol]
I don't know... what do you think of the method ? Is the weight correctly chosen ?


NonlinearModelFithas aWeightsoption. Perhaps you could start there. $\endgroup$