1
$\begingroup$

I'm trying to visualize the geometry of the complex mapping $g(z)=\frac{1}{z}$ using the following codes.

g[x_, y_] := {x/(x^2 + y^2), -y/(x^2 + y^2)};

Manipulate[ParametricPlot[{{Cos[t], Sin[t]},
   {c, 10 t},
   g[c, t]},
   {t, -Pi, Pi}, PlotRange -> {{-5, 5}, {-5, 5}}],
   {c, -3, 3}]

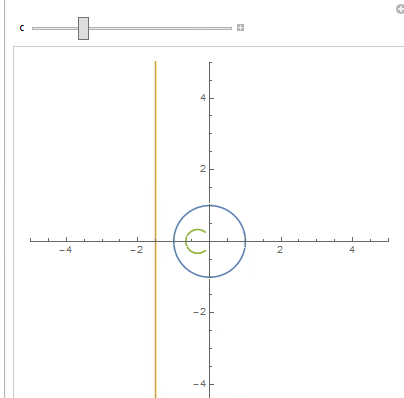
What I want to demonstrate is that the image of a straight line under the mapping $g$ is a circle. (And I use Manipulate to demonstrate the image for different vertical lines.) But I only get part of the circle since the straight line is actually only a segment in the plot.

enter image description here

Could anyone help to fix this?

$\endgroup$
2
  • $\begingroup$ A somehow related topic. $\endgroup$
    – corey979
    Commented Feb 12, 2017 at 20:50
  • $\begingroup$ I didn't mean for you to delete your question, but I couldn't spend the time to write a full answer. Hope you figured it out based on my comment. $\endgroup$
    – Szabolcs
    Commented Feb 13, 2017 at 20:43

2 Answers 2

0
$\begingroup$

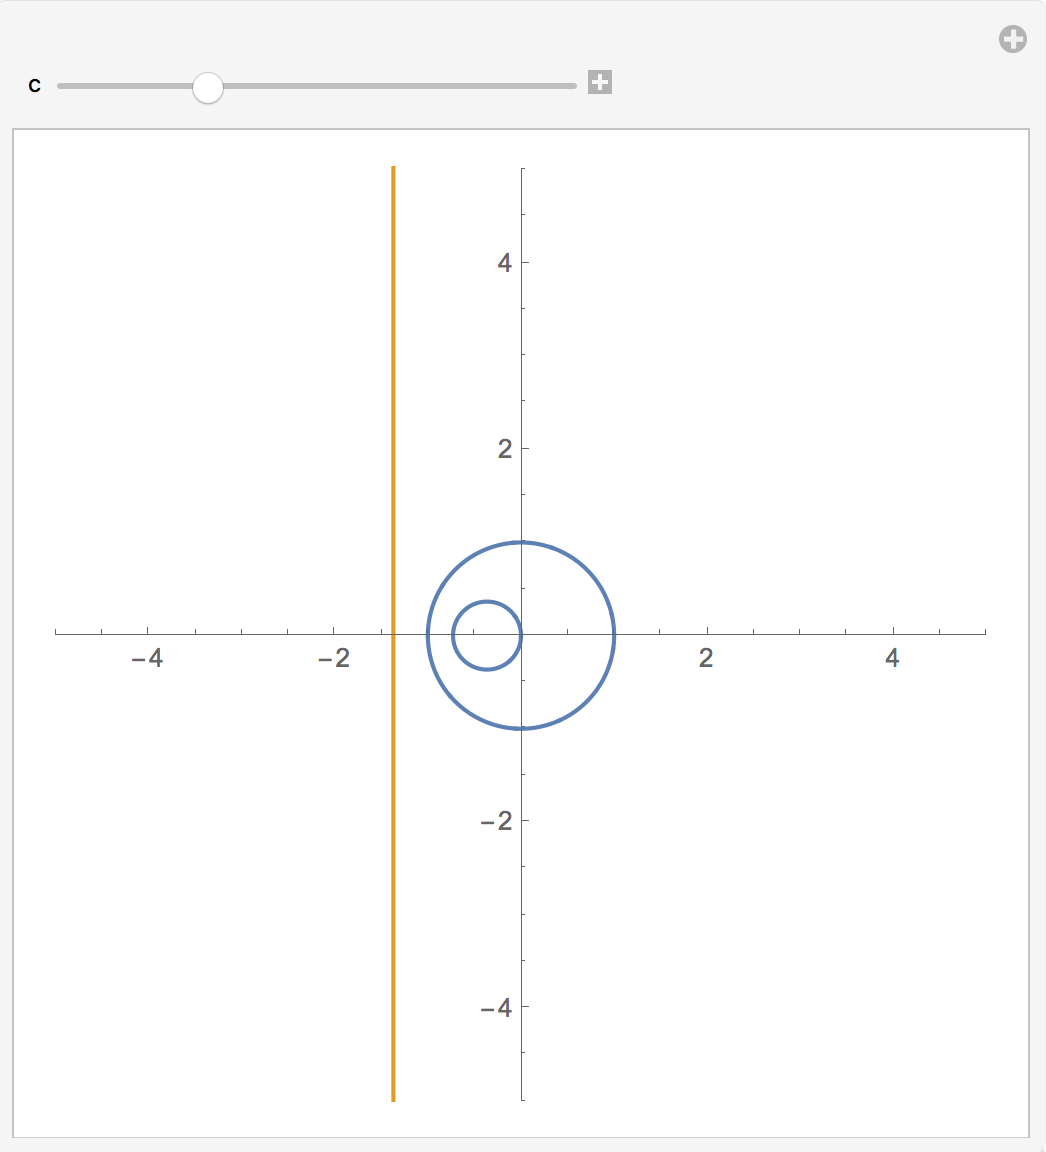
Not perfect but better:

g[x_, y_] := {x/(x^2 + y^2), -y/(x^2 + y^2)};

Manipulate[
 Show[
  ParametricPlot[{{Cos[t], Sin[t]}, {c, 10 t}}, {t, -Pi, Pi}, 
   PlotRange -> {{-5, 5}, {-5, 5}}],
  ParametricPlot[g[c, t], {t, -100, 100}]],
 {c, -3, 3}]

Trick: You can improve the smoothness of the parametric circle during manipulate by replacing the second plot as follows:

Manipulate[
 Show[
  ParametricPlot[{{Cos[t], Sin[t]}, {c, 10 t}}, {t, -Pi, Pi}, 
   PlotRange -> {{-5, 5}, {-5, 5}}],
  ParametricPlot[g[c, t^5], {t, -2, 2}] ],
 {{c, -1.5}, -3, 3}]

enter image description here

$\endgroup$
6
  • 1
    $\begingroup$ Add PlotPoints -> 1000 in ParametricPlot for full of happiness. $\endgroup$
    – user64494
    Commented Feb 12, 2017 at 19:00
  • 1
    $\begingroup$ @user64494 this may be machine-dependent it does not help on my 2015 Macbook Pro. However the above added trick did. $\endgroup$
    – A.G.
    Commented Feb 12, 2017 at 19:22
  • $\begingroup$ Thank you for your answer. What is the -1.5 for in {c, -1.5}, -3, 3}? $\endgroup$
    – user664
    Commented Feb 12, 2017 at 22:47
  • $\begingroup$ Enlighten by your answer, one can replace g[c,t] with g[c,t^7] in my original code to get the desired result. $\endgroup$
    – user664
    Commented Feb 12, 2017 at 22:53
  • 1
    $\begingroup$ @Jack -1.5 is the initial value of c. $\endgroup$
    – A.G.
    Commented Feb 12, 2017 at 23:36
0
$\begingroup$
f[x_, y_] := ReIm[1/(x + I y)]
Manipulate[
 ParametricPlot[{{a + b Cos[t], c + b Sin[t]}, 
   f[a + b Cos[t], c + b Sin[t]]}, {t, 0, 2 Pi}, 
  PlotRange -> {{-4, 4}, {-4, 4}}, 
  PlotLegends -> {"z", "1/z"}], {{a, 0}, -2, 2}, {{b, 1}, 0.1, 
  2}, {{c, 0}, -2, 2}]

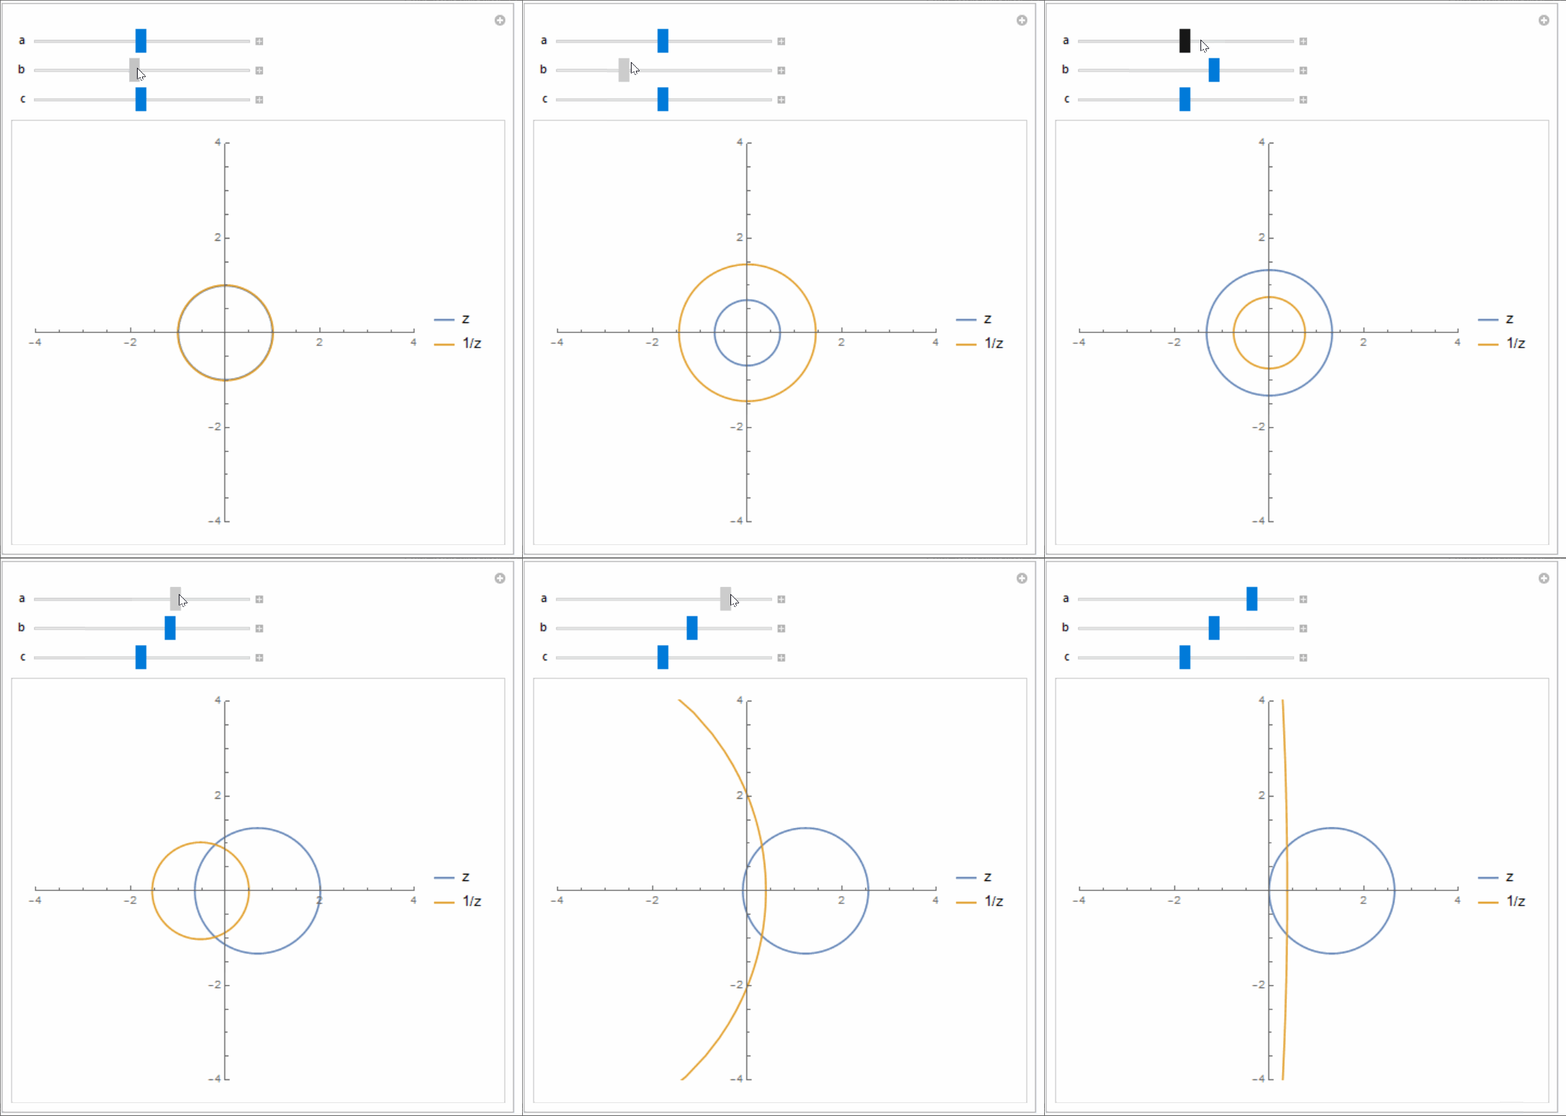
enter image description here

$\endgroup$
3
  • $\begingroup$ I have never seen the use of ReIm before. Thanks! $\endgroup$
    – user664
    Commented Feb 13, 2017 at 16:00
  • $\begingroup$ May I ask how you made the gif from Mathematica? $\endgroup$
    – user664
    Commented Feb 13, 2017 at 16:06
  • $\begingroup$ @Jack I use LICECap $\endgroup$
    – ubpdqn
    Commented Feb 15, 2017 at 7:13

Your Answer

By clicking “Post Your Answer”, you agree to our terms of service and acknowledge you have read our privacy policy.