Following some of the questions here on Mathematica Stack Exchange, I am trying to export an image that contains a rasterized object and vector-graphics axes.
Here is an example:
myArray = Table[{x, y, RandomReal[]}, {x, 0, 100}, {y, 0, 100}];

size = 500;

myImage =
 ListDensityPlot[Flatten[myArray, 1], Mesh -> 20,
  ColorFunction -> "AvocadoColors", PerformanceGoal -> "Quality",
  FrameLabel -> {"\[Mu]", "C"}, FrameStyle -> Directive[14],
  ImageSize -> size];

img = Rasterize[Show[myImage, Frame -> None], ImageResolution -> 100,
   ImageSize -> size];

g = Graphics[
  Inset[img, Scaled[{0.5, 0.5}], {Center, Center}, size],
  AbsoluteOptions[myImage]]
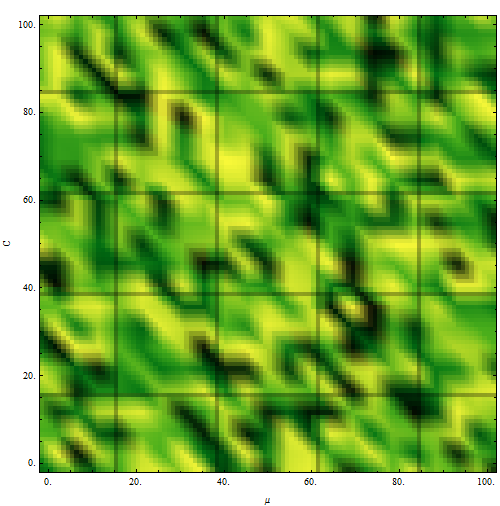
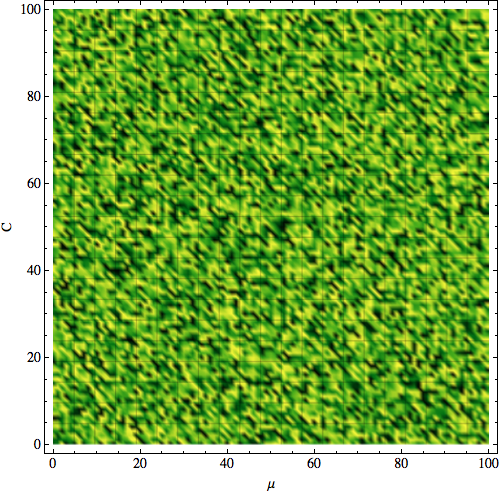
Here is the result::

You can notice, if you compare with the original image, that the scaling of the inserted object is not correct.
Now two my questions:
- How to figure out the size of the object that I insert automatically. Here, if I replace
sizewith0.21 sizeI will get a correct image. Why is 0.21? - Why the size of ticks and numbering does not coincide with the original image and how to fix it?

