I'm sure I've seen this sort of thing done before, but now I can't find a working implementation anywhere.
Below I give a toy example that is just complex enough to illustrate the issues. (I provide full code after the problem's description.)
First, consider this simple (and entirely meaningless) barchart:
In[122]:= With[
 {
   labels = BlockRandom[SeedRandom[-2];
               RandomSample[DictionaryLookup[{"English", ___}], nItems]
            ]
 },
 Framed[
  BarChart[data, ChartLabels -> labels
   , ChartStyle -> LightGray
   , BarOrigin -> Left
   , ImageSize -> 250
   ]
  , FrameStyle -> Thin
  ]
]
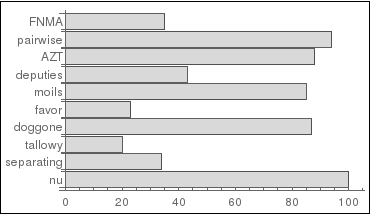
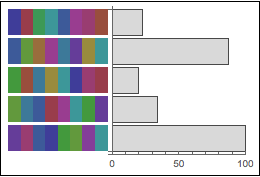
The goal is to replace the text labels along the left with
Graphicobjects, ("graphic labels", if you will), in such a way that these labels scale appropriately with the figure.
For this (rather artificial!) example, the "graphic labels" I have in mind consist of several colored Rectangle objects lined up in a row, like this:

(The black dot just marks the point (0, 0) in the barcode's internal reference frame; it is not part of the barcode.)
I defined a barcode function that, for any integer argument, generates a (random-but-reproducible) "barcode" like the one above.
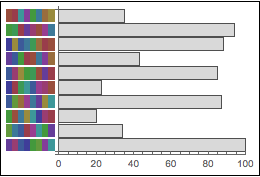
Now, if I substitute such graphic labels for the text ones in the barchart, this is what I get:
In[124]:= With[
 {
   labels = Table[Graphics[barcode[i]], {i, Length[data]}]
 },
 Framed[
  BarChart[data, ChartLabels -> labels
   , ChartStyle -> LightGray
   , BarOrigin -> Left
   , ImageSize -> 250
   ]
  , FrameStyle -> Thin
  ]
]
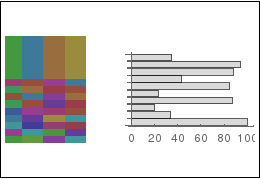
Not great. For one thing, the barcodes come out too big, and too far from the vertical axis.
But most seriously, the size of the barcodes does not change when ImageSize changes. For example, if ImageSize is changed from 250 to 500, the result looks like this:
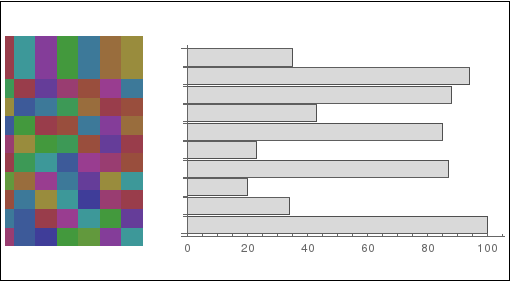
Confusingly enough, even though the size of the barcodes remains constant, the spacing between them changes in proportion to the change in ImageSize.
I'm looking for a way to set the size of the barcodes so that
- the height of the barcode corresponds to 1 plot unit (or slightly less), while preserving the barcode's original aspect ratio;
- the spacing between the barcodes and the (vertical) axis matches that between text labels and the axis;
- both the size of the barcode and the spacing between one barcode and the next one, and between the barcodes and axis scale with the image; (needless to say, the barcodes should always be fully visible irrespective of image size).
With enough trial-and-error, I can find a "solution" that meets requirements (1) and (2) (see under the Best so far heading further below), but I have not been able to find one that also meets requirement (3).
The next section includes all the code referenced above; the last section documents some failed attempts at solving the problem.
Code
nItems = 10;
data = BlockRandom[SeedRandom[-1];
   20 + RandomInteger[80, nItems]
];

With[{
  labels = BlockRandom[SeedRandom[-2];
    RandomSample[DictionaryLookup[{"English", ___}], nItems]
    ]
  },
 Framed[
  BarChart[data, ChartLabels -> labels
   , ChartStyle -> LightGray
   , BarOrigin -> Left
   , ImageSize -> 250
   ]
  , FrameStyle -> Thin
  ]
 ]

palette = ColorData[1, "ColorList"];
basewidth = 0.5;
baseheight = 1;
nstrips = 8;
baserect = Rectangle[{0, 0}, {basewidth, baseheight}];
barcode[index_] := BlockRandom[
  SeedRandom[index];
  Module[{colors = RandomSample[palette, nstrips]},
   Table[Translate[{colors[[i]],
      baserect}, {(i - nstrips - 1) basewidth, -0.5 baseheight}], {i,
     nstrips}]
   ]
  ]

Graphics[{barcode[1], Disk[{0, 0}, 0.05]}, Frame -> True, ImageSize -> Medium]

With[{
  labels = Table[Graphics[barcode[i]], {i, Length[data]}]
  },
 Framed[
  BarChart[data, ChartLabels -> labels
   , ChartStyle -> LightGray
   , BarOrigin -> Left
   , ImageSize -> 250
   ]
  , FrameStyle -> Thin
  ]
 ]

With[{
   labels = Table[Graphics[barcode[i]], {i, Length[data]}]
 },
 Framed[
  BarChart[data, ChartLabels -> labels
   , ChartStyle -> LightGray
   , BarOrigin -> Left
   , ImageSize -> 500
   ]
  , FrameStyle -> Thin
  ]
 ]
Failures
Best so far
Module[{
  FUDGEFACTOR = <|"insetMultiplier" -> 200, "leftPadding" -> 40|>
  , n
  , makeInset
  },
 ; n = Length[data]
 ; makeInset[i_] := Inset[Graphics[barcode[i]]
   , Scaled[{-0.02, 0}, {0, i}]
   , {0, 0}
   , FUDGEFACTOR["insetMultiplier"]/n
   ]
 ; Framed[
  BarChart[data, ChartLabels -> None
   , ChartStyle -> LightGray
   , BarOrigin -> Left
   , ImagePadding -> {{FUDGEFACTOR["leftPadding"], Automatic},
                      {Automatic, Automatic}}
   , ImageSize -> 250
   , Epilog -> Table[makeInset[i], {i, n}]
   ]
  , FrameStyle -> Thin
  ]
 ]
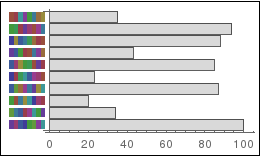
- scheme requires fudge-factors that must be determined by trial-and-error;
- padding to make room for the barcodes does not scale appropriately when image is resized.
Using Scaled
Block[{baserect =
   Rectangle[Scaled[{0, 0}], Scaled[{basewidth, baseheight}]]},
 With[{
   labels = Table[Graphics[barcode[i]], {i, Length[data]}]
   },
  Framed[
   BarChart[data, ChartLabels -> labels
    , ChartStyle -> LightGray
    , BarOrigin -> Left
    , ImageSize -> 250
    ]
   , FrameStyle -> Thin
   ]
  ]
 ]
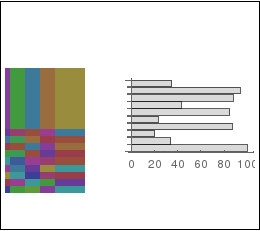
- swatches within barcode overlap
- overall scaling is wrong
- positioning is wrong
Drawing labels in plot-space
With[{
  labels =
   Table[Graphics[Translate[barcode[i], {0, i}]], {i, Length[data]}]
  },
 Framed[
  Show[{
    BarChart[data, ChartLabels -> None
     , ChartStyle -> LightGray
     , BarOrigin -> Left
     , ImageSize -> 250
     ],
    labels
    }
   ]
  , FrameStyle -> Thin
  ]
 ]
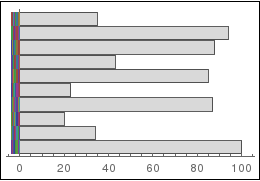
- aspect ratio is wrong
Using Inset
With[{
  labels =
   Graphics[Table[Translate[barcode[i], {0, i}], {i, Length[data]}]]
  },
 Framed[
  BarChart[data, ChartLabels -> None
   , ChartStyle -> LightGray
   , BarOrigin -> Left
   , ImageSize -> 250
   , ImagePadding -> {{50, Automatic}, {120, Automatic}}
   , Epilog -> Inset[labels, {0, 0}]
   ]
  , FrameStyle -> Thin
  ]
 ]
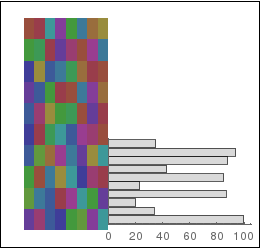
- overall scaling is wrong

Inset? e.gInset[labels, Scaled[{-0.05, 0}], Scaled[{1, 0}], Scaled[1]]$\endgroup$