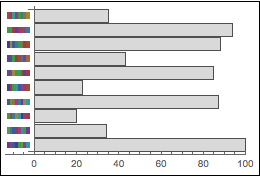
I modified my previous answer to work better with datasets of different length. I rely on the AspectRatio being GoldenRatio. If it isn't, replace GoldenRatio with the appropriate AspectRatio. I also use 3.6 as the width to height ratio of the barcode.
edited to paint over axis below barcodes
makeInset[i_,n_] := Inset[
    Graphics[barcode[i]],
    Scaled[{-0.02,0},{0,i}],
    {0,0},
    Scaled[{3.6,1}/n]
];

bplot[data_] := With[{n = Length[data]},
    Framed[
        BarChart[
                data,
                ChartLabels->None,
                ChartStyle->LightGray,
                BarOrigin->Left,
                PlotRangePadding->{{Scaled[3.6 / (n*GoldenRatio)],0},{0,0}},
                ImageSize->250,
                Epilog->Table[makeInset[i>{
                    White,
                    Rectangle[Scaled[{-1,-1}, {0, 0}], Scaled[{-.02, 1}, {0, 0}]],
                    Table[makeInset[i,n],{i,n}]
                }
            ],
        FrameStyle->Thin
    ]
]
A couple examples:
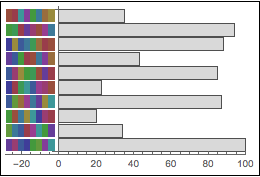
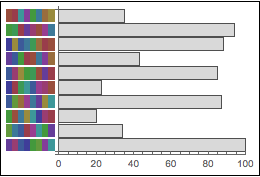
bplot[data]
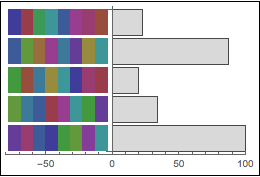
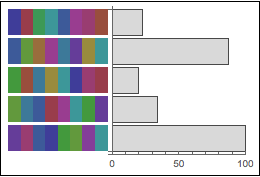
bplot[data[[;;5]]]
The basic idea is to use a scaled inset size, and then increase the PlotRangePadding to accommodate the addition of the barcodes.

