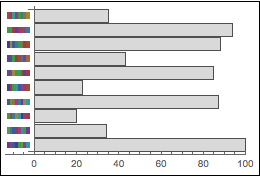
You're most of the way there. Here are a couple tweaks:
makeInset[i_]:=Inset[Graphics[barcode[i]],Scaled[{-0.02,0},{0,i}],{0,0},Scaled[.1]];

Framed[
    BarChart[
        data,
        ChartLabels->None,
        ChartStyle->LightGray,
        BarOrigin->Left,
        PlotRangePadding->{{Scaled[.12],0},{0,0}},
        ImageSize->250,
        Epilog->Table[makeInset[i],{i,Length[data]}]
    ],
    FrameStyle->Thin
]
The basic idea is to use Scaled[.1] as the size of the inset, and then increase the PlotRangePadding to accommodate the addition of the barcodes. I use a PlotRangePadding of Scaled[.12] to account for both the Scaled[{-.02, 0}, {0, i}] position of the inset, as well as the Scaled[.1] size of the inset.

