4
$\begingroup$

I would like to label a curve inside ListLinePlot. Let's say I have the following list:

Table[{x, x^2}, {x, 0, 10, 0.1}]

What I expected is a labeled curve. The label should also be placed above the curve and in the middle. It should also be rotated with the curve like the following picture.

enter image description here

But if I try the following code with ListLinePlot and Labeled:

ListLinePlot[Labeled[Table[{x, x^2}, {x, 0, 10, 0.1}], "x^2", {Top, Center}]]

enter image description here

And I get the following error:

Labeled::labpos: {{Top,Center}} is not a valid position for the placement of labels.

How can I do it properly?

$\endgroup$

3 Answers 3

3
$\begingroup$

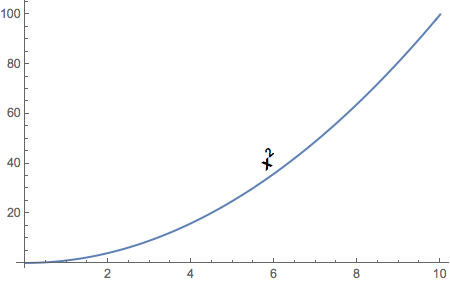
In Version 11.0.1, Labeled can be used in the dataset level.

data = Table[{x, x^2}, {x, 0, 10, 0.1}];
ListLinePlot[Labeled[data, Style[Rotate[x^2, 40 Degree], Bold, 14], {6, 42}]]

The third argument of Labeled in this case is a precise location.

enter image description here

$\endgroup$
4
$\begingroup$

To use Labeled to make the kind of label you want, you have to wrap a specific point with Labeled. You also have to use Rotate to get the rotation.

Here is the code:

data = Table[{x, x^2}, {x, 0, 10, 0.1}];
data[[61]] = Labeled[data[[61]], Rotate[Style[x^2, 14, Bold], 40 °]];
ListLinePlot[data]

data[[61]] is the point {6., 36.}

plot

Update

You can nudge the label with Labeled's 3rd argument. In the following example, I have moved the label somewhat closer to the curve.

data = Table[{x, x^2}, {x, 0, 10, 0.1}];
data[[61]] = Labeled[data[[61]], Rotate[Style[x^2, 14, Bold], 40 °], {.7, 0}];
ListLinePlot[data]

plot

$\endgroup$
1
  • $\begingroup$ Thanks! That's quite what I wanted. But I think the label is a little to far away from the curve. Is there any way to make it a little bit nearer? $\endgroup$
    – 407PZ
    Commented Jan 15, 2017 at 10:28
3
$\begingroup$

Use Text or Inset in Epilog:

ListLinePlot[Table[{x, x^2}, {x, 0, 10, 0.1}], 
 Epilog -> Text[Style[x^2, 15], {4.5, 25}, Automatic, {1, .6}]]

or

ListLinePlot[Table[{x, x^2}, {x, 0, 10, 0.1}], 
 Epilog -> Text[Style["x^2", 15], {4.5, 25}, Automatic, {1, .6}]]

depending on whether you want to math-format the exponent.

enter image description here

$\endgroup$
1
  • $\begingroup$ Shouldn't one of these examples demonstrate the use Inset? $\endgroup$
    – m_goldberg
    Commented Jan 15, 2017 at 0:19

Your Answer

By clicking “Post Your Answer”, you agree to our terms of service and acknowledge you have read our privacy policy.

Not the answer you're looking for? Browse other questions tagged or ask your own question.