2
$\begingroup$

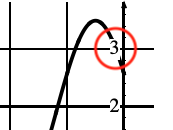
I want the axes' digits of my plots (actually ListLinePlots) to be free from the interference with other background elements (specifically grid lines). To do that I've tried specifying Background->White in the TickLabels option. However, since they're printed on top of the function curve, the white background of the labels hides the function curve when they happen to overlap. Here is a picture of the issue:

enter image description here

(The desired effect is as in the bottom label shown in the image, without the problem of the label circled in red.)

I would like the axes labels to lay in a layer between the background elements and the plotted curve. I have seen a couple of questions relevant to this (1 and 2), but they do not specifically address this issue. (Using Method -> {"AxesInFront" -> False} solves indeed the problem when it's a Plot, but has no effect with ListLinePlot.)

Not sure if this is possible, but I was looking for some solution that does not use any external package.

Here is an example:

ListLinePlot[Table[2 x + 2, {x, -5, 5}], 
 PlotStyle -> Directive[Thick], 
 TicksStyle -> Directive[30, Black, Background -> White], 
 PlotTheme -> {"Grid"}, GridLinesStyle -> Plain, 
 Method -> {"AxesInFront" -> False}]

Note how the digit 4 background overlaps

$\endgroup$
5
  • 3
    $\begingroup$ Epilog? Also, what have you tried so far? Please provide a MWE for us to work off of to help you :) $\endgroup$ Commented Sep 8, 2020 at 3:07
  • $\begingroup$ @ CA Trevillian Thank you so much for the comment. I added an example and while creating it I observed something important: Method -> {"AxesInFront" -> False} does indeed work perfectly when we have a Plot, but it has no effect when it's a ListLinePlot... $\endgroup$
    – abcd
    Commented Sep 8, 2020 at 3:29
  • $\begingroup$ What do you mean “when you have a plot”? When using Plot? Can you, perhaps, observe success when using ListPlot? Did you see what Epilog does? Seemingly this is what you want. $\endgroup$ Commented Sep 8, 2020 at 3:30
  • $\begingroup$ @ CA Trevillian I mean when plotting using the function Plot, as opposed to the function ListLinePlot. I haven't considered Epilog since that requires manual input of the label coordinates... and I have a very high number of plots that need to manage automatically. Even in that case wouldn't Epilog plot on top of everything? $\endgroup$
    – abcd
    Commented Sep 8, 2020 at 3:36
  • 1
    $\begingroup$ correct—I suggest to use Epilog to plot the curve on top of everything. Also perhaps ListPlot works with the method you mention, using Joined->True. This would be convenient for your use if so. $\endgroup$ Commented Sep 8, 2020 at 3:39

2 Answers 2

5
$\begingroup$
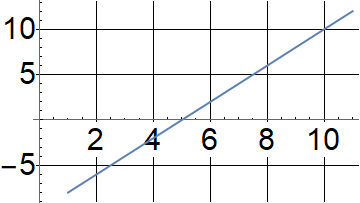
Show[ListLinePlot[Table[2 x + 2, {x, -5, 5}], 
  PlotStyle -> Directive[Thick], 
  TicksStyle -> Directive[30, Black, Background -> White], 
  PlotTheme -> {"Grid"}, GridLinesStyle -> Plain], 
 Method -> {"AxesInFront" -> False}]
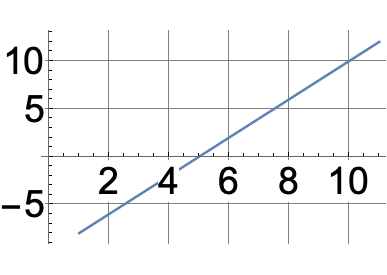
enter image description here

$\endgroup$
3
  • $\begingroup$ kglr thanks! any idea why it doesn’t work directly as option on ListLinePlot and it does a posteriori via Show? I’d like to know if there are more solutions though; this happens to have the effect of behaving differently after rasterizing it as an image: it’s no longer RGB and has 4 channels (what might happen to matter in my case); otherwise this might do indeed for me. $\endgroup$
    – abcd
    Commented Sep 8, 2020 at 4:13
  • 1
    $\begingroup$ @abcd, i am also puzzled why Method -> {"AxesInFront" -> False} works in Plot but not in ListLinePlot. $\endgroup$
    – kglr
    Commented Sep 8, 2020 at 4:16
  • 2
    $\begingroup$ you can also use Epilog as CA Trevillian suggested in comments: ListLinePlot[tbl = Table[2 x + 2, {x, -5, 5}], PlotStyle -> Directive[Thick], TicksStyle -> Directive[30, Black, Background -> White], PlotTheme -> {"Grid"}, GridLinesStyle -> Plain, Epilog -> ListLinePlot[tbl][[1]]] $\endgroup$
    – kglr
    Commented Sep 8, 2020 at 4:22
1
$\begingroup$
Clear["Global`*"]

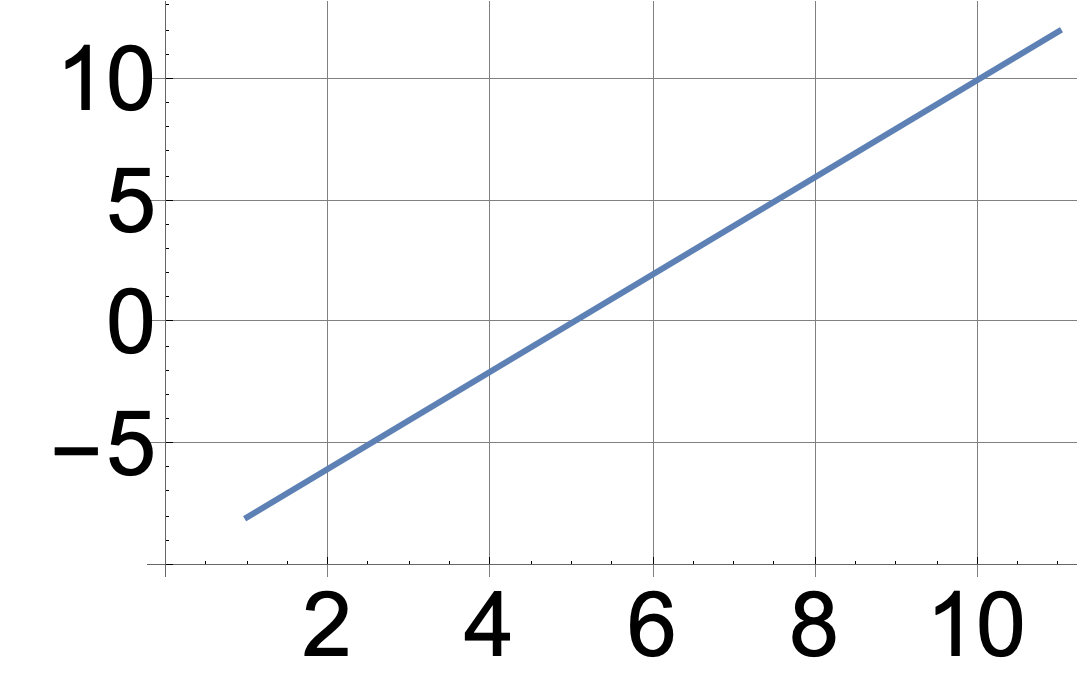
As alternatives you can either shift the AxesOrigin

ListLinePlot[Table[2 x + 2, {x, -5, 5}],
 PlotStyle -> Thick,
 TicksStyle -> Directive[30, Black],
 PlotTheme -> {"Grid"},
 GridLinesStyle -> Plain,
 AxesOrigin -> {0, -10}]

enter image description here

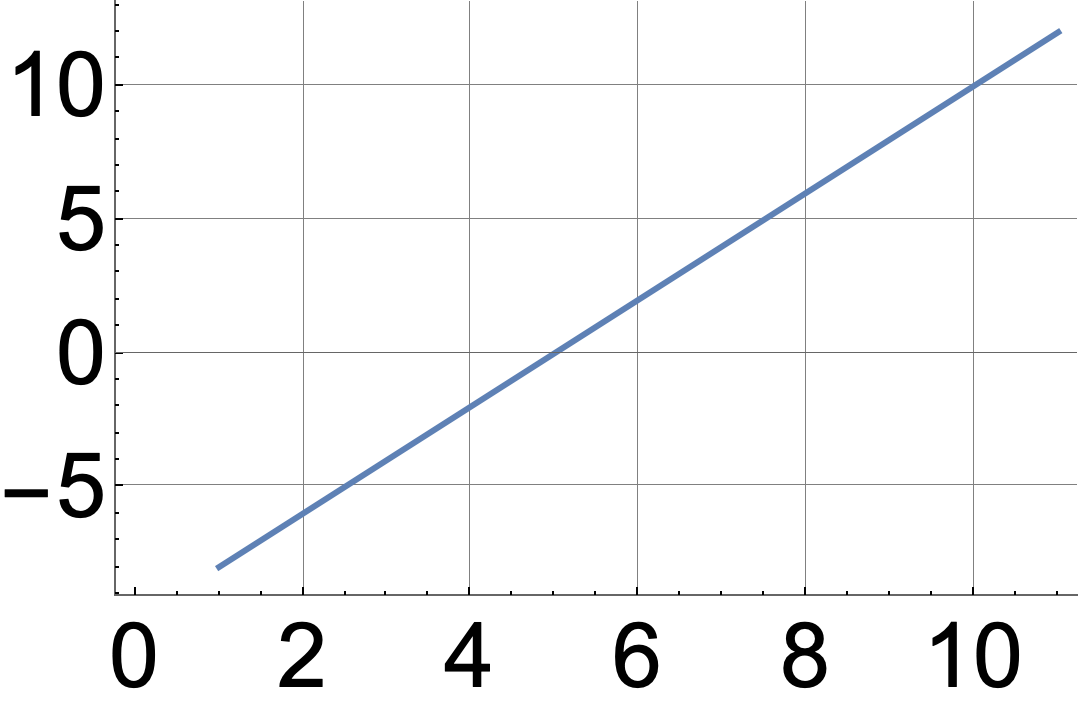
or use a Frame

ListLinePlot[Table[2 x + 2, {x, -5, 5}],
 PlotStyle -> Thick,
 FrameTicksStyle -> Directive[30, Black],
 PlotTheme -> {"Grid"},
 GridLinesStyle -> Plain,
 Frame -> {{True, False}, {True, False}}]

enter image description here

$\endgroup$

Your Answer

By clicking “Post Your Answer”, you agree to our terms of service and acknowledge you have read our privacy policy.

Not the answer you're looking for? Browse other questions tagged or ask your own question.