I am finding the extrema of a function with the code below.
The window over which I am finding the extrema is specified by 'xm', at the very beginning. The window is a simple square, from -xm to +xm in both x and y.
I would like this region to be speficied by a polygon, like an octagon or a pentagon.
I have looked at
RegionPlot, but it does not seem compatible with the function that I use to do the extremisation (end of question), since it is using the window size without doing any plot.The option that I am currently trying but that has not produced results yet is specifying
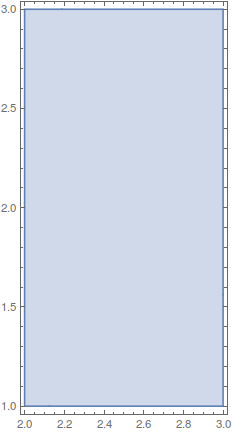
Region = Rectangle[{2, 1}, {3, 3}]
to then limit the extremisation to the Region with:
... ∈ Region
I am starting with a rectangle to be simple, than I guess I'd have to define an octagon / pentagon with lines and vertices. I don't really have an idea of the correct syntax this should be used in so I am trying out different combinations.
Any pointers, help?
--
CODE:
α = 100;
beams = 8;
angle = (2 π)/beams;
xm = {6,10};
plotting = True;


k0 = 2 π;
k0 = {k0, 0};
k = Table[FullSimplify[RotationMatrix[n*angle]. k0], {n, 0, beams - 1}];


epol[θ_, ϕ_] := {Sin[θ]*Cos[ϕ],
   Sin[θ]*Sin[ϕ], Cos[θ]};
θ = ConstantArray[0, beams];
ϕ = ConstantArray[0, beams];


Intensity = ConstantArray[1, beams]; (* Intensity of each beam *)
δ = ConstantArray[0, beams]; (* Phase of each beam *)
Efield[x_, y_] :=
 Table[Sqrt[Intensity[[n]]]*Exp[I k[[n]].{x, y} - I δ[[n]]]*
   epol[θ[[n]], ϕ[[n]]], {n, 1, beams}]


Efieldtot[x_, y_] := Sum[Efield[x, y][[n]], {n, 1, beams}]
Potential[x_,
  y_] := α*
    Sum[Conjugate[Efieldtot[x, y][[n]]]*Efieldtot[x, y][[n]], {n, 1, 3}] //
   ComplexExpand // Simplify

usefulstuff =
  Table[FindExtrema[Potential, xm[[n]], 250], {n, 1, Length[xm]}];
where the Function to extremise is:
FindExtrema[potential_, windowsize_, points_] :=
 Module[ {dx, dy, hl, x, y, hes, crit, mnp, mxp, sdp, mini, maxi,
   sadl},
  {dx[x_, y_], dy[x_, y_]} = D[potential[x, y], {{x, y}}];
  hes[x_, y_] = D[potential[x, y], {{x, y}, 2}];
  crit = Cases[
    Normal[ContourPlot[
      dx[x, y] == 0, {x, -windowsize/2, windowsize/
       2}, {y, -(windowsize/2), windowsize/2}, PlotPoints -> points,
      ContourStyle -> None, Mesh -> {{0}},
      MeshFunctions -> Function[{x, y, z}, dy[x, y]]]],
    Point[{x0_, y0_}] :> ({\[FormalX], \[FormalY]} /.
       FindRoot[{dx[\[FormalX], \[FormalY]],
         dy[\[FormalX], \[FormalY]]}, {{\[FormalX], x0}, {\[FormalY],
          y0}}]), ∞];
  hl = hes @@@ crit;
  mnp = PositiveDefiniteMatrixQ /@ hl;
  mxp = PositiveDefiniteMatrixQ /@ (-hl);
  sdp = Thread[mnp ⊽ mxp];
  mini = Pick[crit, mnp];
  maxi = Pick[crit, mxp];
  sadl = Pick[crit, sdp];
  {mini, potential @@@ mini, hes @@@ mini, maxi, potential @@@ maxi,
   hes @@@ maxi}
  ]
--


