Short Version
Given:
$ds = <|"i1"->{a11,a12,a13},"i2"->{a21, a22, a23},"i3"->{a31, a32, a33}|> // Dataset;
Here are some work-arounds (valid for V11.0.1):
Block[{Dataset`$UseNewDatasetFormatting = False}
, Print @ $ds[All, All, ToString]
]

$ds[All, List]

... or using asTuple which is defined in the long version below:
$ds[All, asTuple]

Long Version
You can return to V10 dataset styling using:
Dataset`$UseNewDatasetFormatting = False;
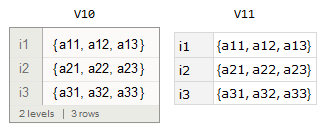
As we shall see below, this will restore the grid-like visualization for some datasets similar to the one exhibited in the question. However, for the question's dataset V10 also does not expand the assocation lists into grid columns:

But... there are definitely some significant differences between V10 and V11 rendering. Consider the following datasets:
integers[] :=     <| "a" -> { 1,   2 }, "b" -> { 4,   5 }, "c" -> { 7,   8 } |> // Dataset
strings[] :=      <| "a" -> {"1", "2"}, "b" -> {"4", "5"}, "c" -> {"7", "8"} |> // Dataset
symbols[] :=      <| "a" -> {a1,  a2 }, "b" -> {a4,  a5 }, "c" -> {a7,  a8 } |> // Dataset
mixedColumns[] := <| "a" -> { 1,  a2 }, "b" -> { 4,  a5 }, "c" -> { 7,  a8 } |> // Dataset
mixed[] :=        <| "a" -> { 1,  a2 }, "b" -> {"4", a5  }, "c" -> { 7, a8 } |> // Dataset

$datasets = {integers, strings, symbols, mixedColumns, mixed};
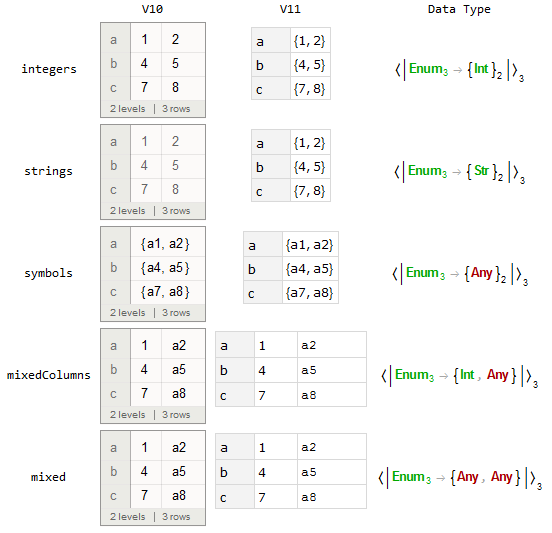
The following table shows the differences between the V10 and V11 rendering:
oldAndNewBoxes[n_] :=
  { n
  , Block[{Dataset`$UseNewDatasetFormatting = False}, MakeBoxes[#]&[n[]] // RawBoxes]
  , MakeBoxes[#]&[n[]] // RawBoxes
  , Dataset`GetType[n[]]
  }

$datasets // Query[Prepend[{"", "V10", "V11", "Data Type"}] /* Grid, oldAndNewBoxes]

We can see that V10 would render the association values as grid columns for a wider range of data types than the new V11 visualization does. This might be a bug worth reporting to WRI.
Discussion
We can see that the V11 choice of visualization is sensitive to the data type of the association values. When the data type is Vector, then the list is shown verbatim. When the data type is Tuple, then the list is expanded into grid columns -- except when the tuple elements are symbols.
In V10, both the Vector and Tuple types are rendered as grids except for the all-symbol case.
Mathematica uses heuristics to determine data type and also to choose the visualization based upon the data type. These heuristics have changed frequently across the releases since Dataset was first released in version 10.
Work-arounds (V11.0.1)
Any work-arounds will be sensitive to Dataset heuristic changes in future releases. However, here are some work-arounds that are current for version 11.0.1.
1) Use the old styling and convert symbols to strings.
As we can see from the table, reverting to the old styling will work around the problem most of the time -- except for the troublesome case of all-symbol values. We can work around that by converting them to strings for visualization:
$ds = <|"i1"->{a11,a12,a13},"i2"->{a21, a22, a23},"i3"->{a31, a32, a33}|>//Dataset;

Block[{Dataset`$UseNewDatasetFormatting = False}
, Print @ $ds[All, All, ToString]
]

2) Convert the lists to 2-D arrays.
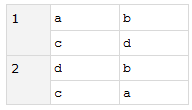
In V11, two-dimensional arrays are rendered as grids -- even for symbols. For example:
{1 -> {{a, b}, {c, d}}, 2 -> {{d, b}, {c, a}}} // Association // Dataset

By converting our vectors into single-row arrays we can exploit this visualization:
$ds[All, List]

3) Engage in an academic exercise.
Both of the preceding work-arounds require changing the structure of the dataset. For visualization purposes only, this might be acceptable. We might wish to retain the original structure to exploit the new V11 interactivity features such as copying an element's value, or determining an element's "address" within the structure.
The following method will retain the original data and yet still influence the visualization. But the method is very brittle and relies upon unsupported internal details of Mathematica. So, just for fun...
ClearAll[asTuple]
SetAttributes[asTuple, HoldAll]

asTuple /: TypeSystem`Inference`PackagePrivate`apply0[asTuple, {type_}] :=
  type /. TypeSystem`Vector[t_, n_] :> TypeSystem`Tuple @ ConstantArray[t, n]

asTuple[x_] := x

TypeSystem`ResetTypeApplyCache[]
This defines asTuple as an identity function. In addition, it hooks the type system to always assume that the result is a tuple when its argument is a vector. The type cache is cleared for good measure in case any of the relevant data types have already been inferred during Dataset usage prior to defining asTuple.
With this in place, we get the visualization we desire:
$ds[All, asTuple]

integers[][All, asTuple]


