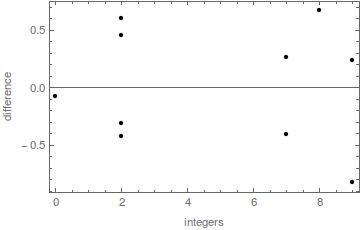
I have a data file from which I import data to lists,
list1 = Import["path", "Table"]
it returns a list in the following form,
list1 = {{9,2.5},{2,3.5},{3,4.5},....}
Now I have another list2 which is of same length as list1.
When I try
list2-list1
I get
{{0,xx},{0,yy},{0,zz},...}
But, I would like to make a difference plot (list2-list1) vs whole numbers (9, 2, 3).
How do I do this?

