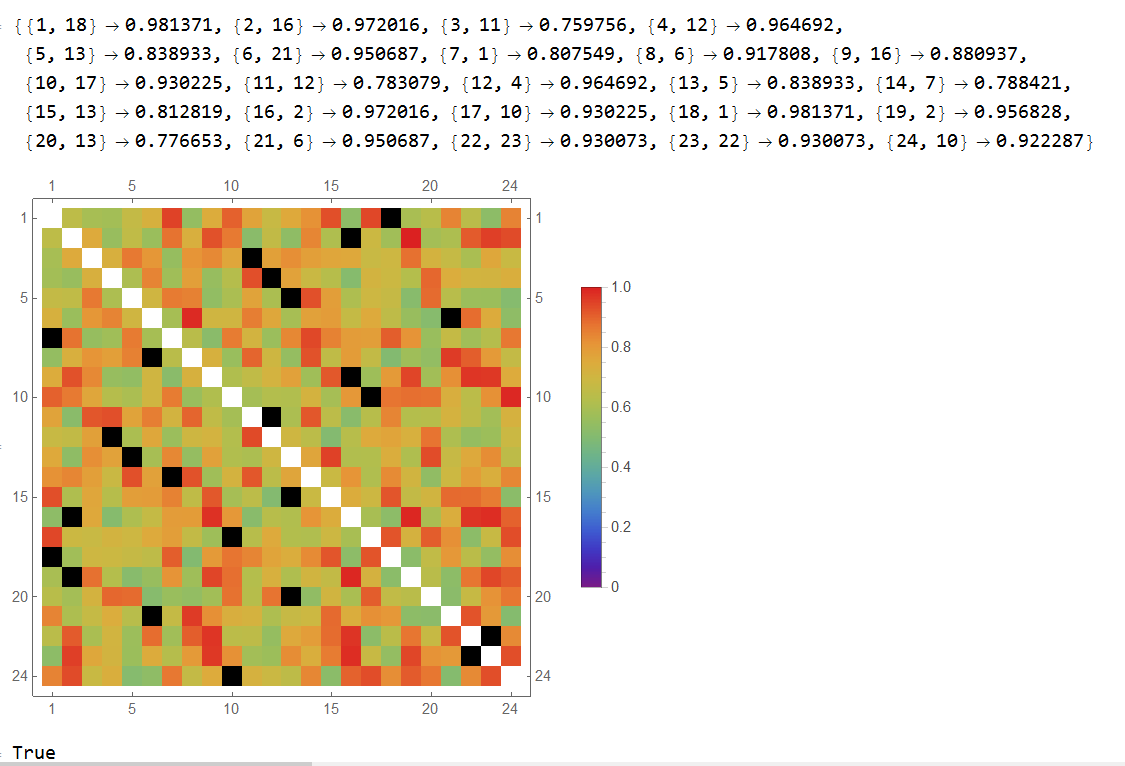
I would like to determine which pattern has the greatest correlation with each sublist.
I have the following data:
data = {{0.6043664420589688`, 0.9857728765270476`,
0.5425821703751481`, 0.15504309122370524`,
0.8276861413622156`}, {0.5425821703751481`, 0.15504309122370524`,
0.8276861413622156`, 0.3117288541104692`,
0.4230554403012381`}, {0.8276861413622156`, 0.3117288541104692`,
0.4230554403012381`, 0.05368581732943603`,
0.1285684468267231`}, {0.4230554403012381`, 0.05368581732943603`,
0.1285684468267231`, 0.568487372004134`,
0.9595968642236314`}, {0.1285684468267231`, 0.568487372004134`,
0.9595968642236314`, 0.748598034746261`,
0.5760672090376757`}, {0.9595968642236314`, 0.748598034746261`,
0.5760672090376757`, 0.8226326906088341`,
0.08882777194355806`}, {0.5760672090376757`, 0.8226326906088341`,
0.08882777194355806`, 0.21758856941067833`,
0.6896577869437517`}, {0.08882777194355806`, 0.21758856941067833`,
 0.6896577869437517`, 0.3515760303307617`,
0.8666214369119132`}, {0.6896577869437517`, 0.3515760303307617`,
0.8666214369119132`, 0.0015663158972453776`,
0.6448673801479466`}, {0.8666214369119132`,
0.0015663158972453776`, 0.6448673801479466`, 0.6775921340346936`,
0.38830057970317`}, {0.6448673801479466`, 0.6775921340346936`,
0.38830057970317`, 0.0875520713672823`,
0.04050093808897781`}, {0.38830057970317`, 0.0875520713672823`,
0.04050093808897781`, 0.6918192575076461`,
0.8457184093280218`}, {0.04050093808897781`, 0.6918192575076461`,
0.8457184093280218`, 0.9325089801435771`,
0.21281479672676218`}, {0.8457184093280218`, 0.9325089801435771`,
0.21281479672676218`, 0.3800904033971768`,
0.42266296902678374`}, {0.21281479672676218`, 0.3800904033971768`,
 0.42266296902678374`, 0.878823162814141`,
0.08424634990003906`}, {0.42266296902678374`, 0.878823162814141`,
0.08424634990003906`, 0.8116030313930428`,
0.46306610480315225`}, {0.08424634990003906`, 0.8116030313930428`,
 0.46306610480315225`, 0.1302251280678801`,
0.5081791408623634`}, {0.46306610480315225`, 0.1302251280678801`,
0.5081791408623634`, 0.9889703407842088`,
0.3742383328595942`}, {0.5081791408623634`, 0.9889703407842088`,
0.3742383328595942`, 0.9126365586572017`,
0.8185213539186117`}, {0.3742383328595942`, 0.9126365586572017`,
0.8185213539186117`, 0.6373943104534471`,
0.507616895947681`}, {0.8185213539186117`, 0.6373943104534471`,
0.507616895947681`, 0.9110702427599564`,
0.17365397377066502`}, {0.507616895947681`, 0.9110702427599564`,
0.17365397377066502`, 0.9598021764187534`,
0.11931631624451103`}, {0.17365397377066502`, 0.9598021764187534`,
 0.11931631624451103`, 0.8235181713926741`,
0.1331530356816872`}, {0.11931631624451103`, 0.8235181713926741`,
0.1331530356816872`, 0.2679829189111074`, 0.2735979069164892`}};
I have a set of patterns which may fit certain sublists, found by taking the 3/4 and 1/4 quantiles at each position within each sublist, as follows:
aa = Quantile[data[[All, #]], 3/4] & /@ Table[i, {i, 1, 5}];
bb = Quantile[data[[All, #]], 1/4] & /@ Table[i, {i, 1, 5}];
patterns = Tuples[Transpose@{aa, bb}]
I would like to find which pattern (such as patterns[[1,All]]) has the greatest Absolute correlation (ie. correlation of -1 can be the greatest correlation) with each sublist in data.
I would like the output to follow the following format:
{{1,30}...{24,5}}
Where {1,30} represents sublist 1 having the highest correlation with pattern 30 (take into account that I did not check if this statement is true).
The data provided in this example is random as I am working with a much larger dataset and stackexchange will not allow me to post all of it. Thank you for your help!
EDIT: So far I have been able to calculate the correlations the following code found in a different answer on stackexchange:
N[Table[Map[Correlation[data[[i, All]], #] &, patterns], {i,Length[data]}]]
I can also find the Maximum points with:
datapatterncor =N[Table[Map[Correlation[data[[i, All]], #] &, patterns], {i,
 Length[data]}]];
But I still cannot find a way to automate the process of finding the positions of the values with the greatest distance from zero in each sublist.


ListCorrelate. $\endgroup$Correlation? $\endgroup$