QdB = Range[-10, 15];

QConst = 10^(QdB/10);

Clear[bConst];

bConst = N[bConst /.
     Solve[
       1 - (bConst - 2/#)*Beta[1, 2]*
          Hypergeometric2F1[2, 1, 3, 1 - bConst] == 8/10,
       bConst, Reals][[1]]] & /@ QConst

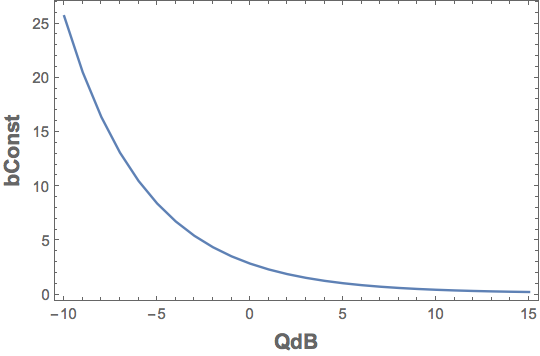
(*  {25.6843, 20.5017, 16.3782, 13.0965, 10.4836, 8.40259, 6.74435, \
5.42232, 4.36775, 3.52598, 2.8536, 2.31611, 1.88608, 1.54172, \
1.26569, 1.0442, 0.866294, 0.72324, 0.608089, 0.515304, 0.440473, \
0.380073, 0.331294, 0.291885, 0.260043, 0.234322}  *)

ListLinePlot[bConst,
 DataRange -> QdB[[{1, -1}]],
 Frame -> True, Axes -> False,
 FrameLabel -> (Style[#, 14, Bold] & /@
    {"QdB", "bConst"})]

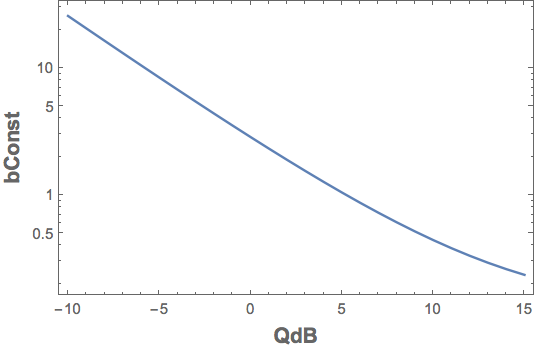
ListLogPlot[bConst,
 Joined -> True,
 DataRange -> QdB[[{1, -1}]],
 Frame -> True, Axes -> False,
 FrameLabel -> (Style[#, 14, Bold] & /@
    {"QdB", "bConst"})]


FunctionExpandon the left hand side. $\endgroup$