4
$\begingroup$

What I have is a dataset data = Transpose[{x,y}] that looks something like this (in practice I have a ton of these, some of them with much more points, but I figured I would stick to the one that gets the point across) enter image description here
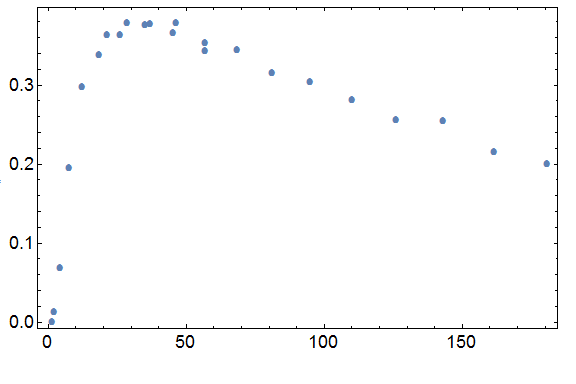
What I would like to do is cluster points that are close together. What I mean by this I would envision in a few ways. The easiest is that if $x_{i+1}-x_i \leq x_{min}$ and $y_{i+1}-y_{i} \leq y_{min}$, I would like to replace $\{x_i,y_i\}$ and $\{x_{i+1},y_{i+1}\}$ by their mean x and y value in some new dataset.

Now, I suppose for this one would use Differences, together with some criteria xmin and ymin that the user sets. I have to admit that I get stuck very quickly, but let me at least paste the data and give some starting point

data = {{1.65, 0.}, {2.33287, 0.0126948}, {4.38148, 0.0676046}, {7.79583, 
  0.193945}, {12.5759, 0.297199}, {18.7218, 0.337641}, {21.5625, 
  0.362302}, {26.2333, 0.363058}, {28.7531, 0.37794}, {35.1106, 
  0.375451}, {37.05, 0.377025}, {45.3537, 0.36488}, {46.4531, 
  0.378526}, {56.9625, 0.343219}, {56.9625, 0.352874}, {68.5781, 
  0.344392}, {81.3, 0.314263}, {95.1281, 0.303282}, {110.063, 
  0.280359}, {126.103, 0.255028}, {143.25, 0.254428}, {161.503, 
  0.21491}, {180.863, 0.199256}};

xmin = 3;
ymin = 0.3;
diff = Differences@data;

Note that these values for xmin and ymin are just a guess, one would obviously have to tune them to their own preference. Then.. we start running into conditionals and loops and such. I know that in Mathematica one generally doesn't use loops, but mappings and tables instead. I have to admit that I honestly don't really know where to go with this. Something using Replace, Abs[data[[i,All]]-data[[i+1,All]]]<=xmin&&Abs[data[[All,i]]-data[[All,i]]]<=ymin, Mean[..] and then some more.

So my question is if someone could help me out set this up. I would be happy if for example the first two points get merged, and some of the points around the maximum, but the rest should be more or less left alone. That is to give an indication of what I am after; I can do the tweaking myself of course.

$\endgroup$

2 Answers 2

6
$\begingroup$
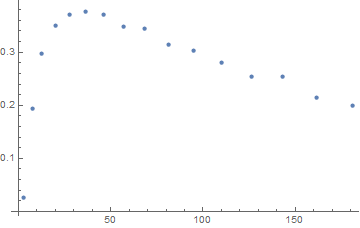
 ListPlot[Mean /@ Gather[data, Norm[(#1 - #2)/{10,1}] < .3 &] ]

enter image description here

or your actual criteria like this:

ListPlot[Mean /@ 
  Gather[data, 
   Abs[(#1 - #2)[[1]]] < 3 && Abs[(#1 - #2)[[2]]] < .3 &] ]
$\endgroup$
2
  • $\begingroup$ Amazing. Mathematica has such a variety of built in stuff, it's crazy. So essentially what this does is tell Gather what it should consider as two points being equal, and then takes the means of the points that are equal according to those criteria? $\endgroup$
    – user129412
    Commented Aug 10, 2016 at 15:46
  • $\begingroup$ yes its always useful to hunt for a built in capability. If you run this : Gather[data, Norm[(#1 - #2)/{10, 1}] < .3 &] // MatrixForm it should be clear how that works. $\endgroup$
    – george2079
    Commented Aug 10, 2016 at 15:51
3
$\begingroup$

I suppose this will be a better optimized and more robust solution:

ratio = .3

r = -Subtract @@ MinMax@# & /@ Transpose@dat;
crit = RankedMin[Norm[#/r] & /@ Differences[dat], 
   Floor[ratio Length@dat]];
datn = Mean /@ Split[dat, Norm[(#1 - #2)/r] <= crit &];
ListPlot@datn

The only thing you should do is to specify the ratio, which represents how much points you want to merge, here it's 0.3 which means 30% of the points will be merged.

Then everything will be done by Mathematica~ Even simpler, right? You won't need to adjust those xvalues and yvalues on your own~

$\endgroup$
3
  • $\begingroup$ I haven't fully gone through the code yet, but what does ratio specify? The amount of points I want to end up with, or how close the points are? As in, I don't necessarily want to end up with less points if all of them are well separated. $\endgroup$
    – user129412
    Commented Aug 10, 2016 at 15:57
  • $\begingroup$ It represents how much points you want to delete. 0.3 means delete 30% of the points. If you want no points deleted, you can simply set it to 0. You may plot ListPlot[Norm[#/r] & /@ Differences[dat]] before you select the ratio, check how near you want the points to be. If you still want to specify everything by yourself, you can manually set r. $\endgroup$
    – Wjx
    Commented Aug 10, 2016 at 16:07
  • 1
    $\begingroup$ Also, when there're numerous points, and they're ordered, Using Split will be much better in speed, but if your points' order is messed up, then use Gather. You may check it yourself. $\endgroup$
    – Wjx
    Commented Aug 10, 2016 at 16:11

Your Answer

By clicking “Post Your Answer”, you agree to our terms of service and acknowledge you have read our privacy policy.

Not the answer you're looking for? Browse other questions tagged or ask your own question.