Suppose I have a (very large) noisy data set of points $(x_i, y_i)$ and I want to smooth it. Mathematica seems to have a number of smoothing schemes (EstimatedBackground[], ListConvolve[], etc) but they all seem to have the underlying assumption that the data is sampled at regular intervals (and thus, usually takes a flat list of numbers as input), which is not my case (nor, I suspect, is it the case particularly frequently). Is there some more or less standard way to deal with this?
$\begingroup$
$\endgroup$
15
-
$\begingroup$ But you need some assumption about the underlying relation and the noise. Otherwise your perceived "noise" could be your signal. $\endgroup$– Dr. belisariusCommented Oct 6, 2014 at 16:17
-
$\begingroup$ @Belisarius Of course. In my case I am doing a computational experiment where I am computing spectral invariants of random (in a certain sense) matrices (so, I have a list of pairs of the form (eigenvalue, some_function_of_eigenvector) of my matrices, which, to make things more annoying, are not precisely the same size. If I do the experiment 1000 times, and compute the mean of my function, and plot it vs the ordinal number of eigenvector, all is well, and the curve is smooth. If I want to plot it against the corresponding eigenvalue, lots of noise. Moving average does sort of work, but... $\endgroup$– Igor RivinCommented Oct 6, 2014 at 16:23
-
$\begingroup$ ... is not clearly the right thing. In any case, there is the actual mathematical/scientific problem, and then there is the functionality provided by mathematica, which seems to not be quite what is needed (of course, I can write my own Gauss convolver, or whatever, but this will be actual work and run slowly, too boot :() $\endgroup$– Igor RivinCommented Oct 6, 2014 at 16:24
-
1$\begingroup$ @IgorRivin Can you supply a sample data set or should I experiment on one of my own ? $\endgroup$– SektorCommented Oct 6, 2014 at 16:35
-
$\begingroup$ @Sektor Sure, watch this space for the Dropbox link. $\endgroup$– Igor RivinCommented Oct 6, 2014 at 16:36
|
Show 10 more comments
2 Answers
$\begingroup$
$\endgroup$
3
Mathematica 10 has new interesting functions for irregularly spaced data like MovingMap
data = RandomReal[1, {1000, 2}];

ListLinePlot[MovingMap[Mean, data, {{0.1}}]]

-
$\begingroup$ Aha! That could be what I am looking for, I will check it out and report! $\endgroup$ Commented Oct 6, 2014 at 19:07
-
$\begingroup$ But wait, this is just a generalized
MovingAverage[]$\endgroup$ Commented Oct 6, 2014 at 19:09 -
$\begingroup$ @IgorRivin, what functionality were you expecting? $\endgroup$ Commented Oct 24, 2014 at 19:11
$\begingroup$
$\endgroup$
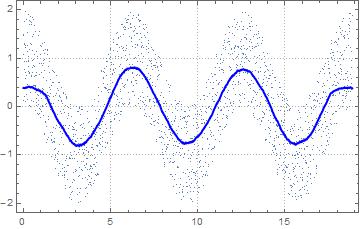
2
Show[
   ListPlot[#,
    DataRange -> {0, 6 Pi},
    PlotTheme -> "Detailed",
    PlotStyle -> PointSize[Tiny]],

   ListLinePlot[
    MovingMap[Mean, #, {{250}, Center}, 0],
    PlotStyle -> {Thick, Blue},
    DataRange -> {0, 6 Pi}]] & [Table[Cos[x] + RandomReal[{-1, 1}], {x, 0, 6 Pi, 0.01}]]

-
$\begingroup$ I will try with my data, and report. $\endgroup$ Commented Oct 6, 2014 at 20:19
-
$\begingroup$ On second thought, your data is actually regularly spaced (and so, just like the built-in stuff, you are not using the abscissas...) $\endgroup$ Commented Oct 6, 2014 at 21:04
