9
$\begingroup$

Bug introduced in 10.4 or earlier and persisting through 12.0


Consider the following example:

ClearAll["Global`*"];

Needs["ErrorBarPlots`"];

x=Table[n,{n,1,100}];

SeedRandom[314];
y=RandomReal[{9,10},100];
yErr=RandomReal[{0,1},100];

yWithErrors=Transpose[{Transpose[{x,y}],ErrorBar/@yErr}];

ErrorListPlot[yWithErrors, Joined -> True, PlotStyle -> {Blue}, 
 Epilog -> {PointSize[Large], Point[Transpose[{x, y}]]}, 
 PlotRange -> All, Frame -> True, 
 FrameLabel -> {{"y", ""}, {"x", ""}}, 
 BaseStyle -> {FontSize -> 20, FontFamily -> "Calibri"}, 
 ImageSize -> 600]

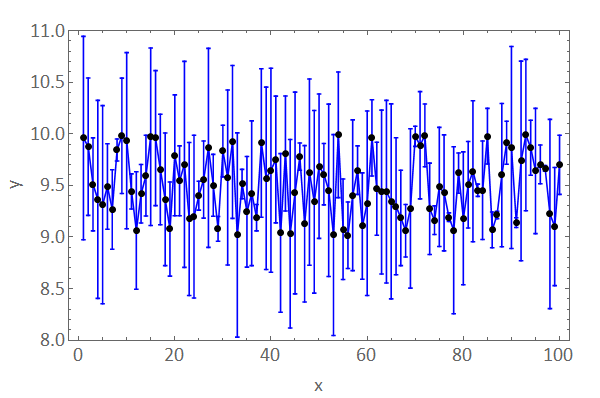
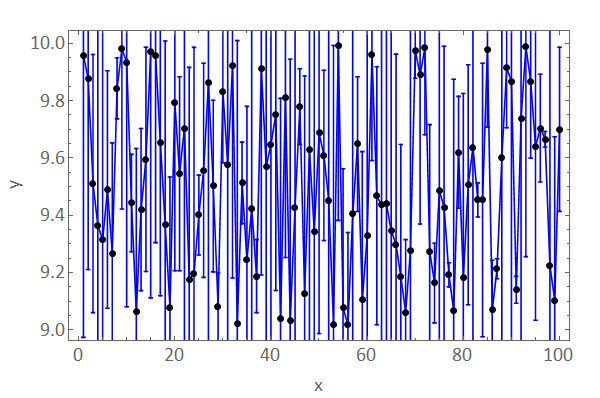
Independently if I use PlotRange -> All, PlotRange -> Total or PlotRange -> Automatic the output is:

enter image description here

As you see the error bars are not completely visible.

Is the only solution to see the error bars to set the PlotRange manually?

ErrorListPlot[yWithErrors, Joined -> True, PlotStyle -> {Blue}, 
 Epilog -> {PointSize[Large], Point[Transpose[{x, y}]]}, 
 PlotRange -> {All, {8, 11}}, Frame -> True, 
 FrameLabel -> {{"y", ""}, {"x", ""}}, 
 BaseStyle -> {FontSize -> 20, FontFamily -> "Calibri"}, 
 ImageSize -> 600]
enter image description here

$\endgroup$
5
  • $\begingroup$ seems like a version 10 issue; it doesn't arise in v9 $\endgroup$
    – kglr
    Commented Jul 18, 2016 at 13:01
  • $\begingroup$ I am running 10.4.1 (Win 64bit Pro). $\endgroup$
    – mrz
    Commented Jul 18, 2016 at 13:03
  • 1
    $\begingroup$ This is a bug. ErrorListPlot is no longer considering the error bars when calculating the plot range. You get the exact same plot range regardless of how large the errors are. $\endgroup$
    – Jason B.
    Commented Jul 18, 2016 at 14:35
  • 1
    $\begingroup$ I reported this as a bug. A simpler example that shows the issue would be ErrorListPlot[{.1 #, .8} & /@ Range[10], PlotRange -> All], which also shows the utility of kglr's workaround. $\endgroup$
    – Jason B.
    Commented Jul 18, 2016 at 15:05
  • $\begingroup$ The same problem with version 11 ... Three weeks ago I informed the technical support and they reproduced the problem with version 10.4.1, but that's it ... $\endgroup$
    – mrz
    Commented Aug 12, 2016 at 8:07

1 Answer 1

10
$\begingroup$

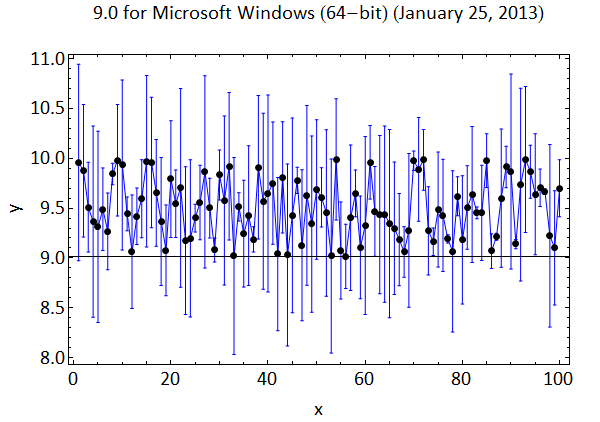
In version 9, PlotRange -> All in ErrorListPlot works as expected:

ErrorListPlot[yWithErrors, Joined -> True, PlotStyle -> {Blue}, 
 Epilog -> {PointSize[Large], Point[Transpose[{x, y}]]}, 
 PlotRange -> All, Frame -> True, 
 FrameLabel -> {{"y", ""}, {"x", ""}}, 
 BaseStyle -> {FontSize -> 20, FontFamily -> "Calibri"}, 
 ImageSize -> 600, PlotLabel -> Style[$Version, 20]]

Mathematica graphics

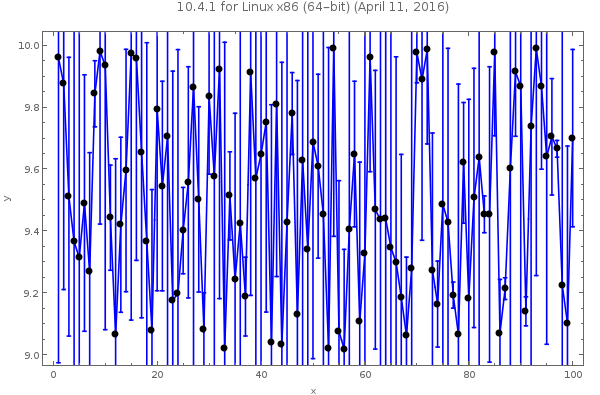
In versions 10+,

elp=ErrorListPlot[yWithErrors, Joined -> True, PlotStyle -> {Blue}, 
 Epilog -> {PointSize[Large], Point[Transpose[{x, y}]]}, 
 PlotRange -> All, Frame -> True, 
 FrameLabel -> {{"y", ""}, {"x", ""}}, 
 BaseStyle -> {FontSize -> 20, FontFamily -> "Calibri"}, 
 ImageSize -> 600, PlotLabel->Style[$Version, 20]]

gives

Mathematica graphics

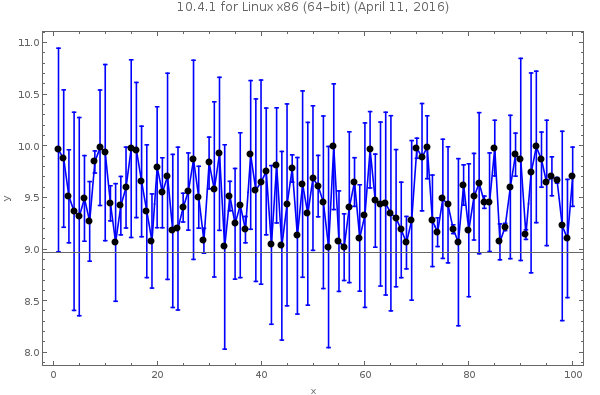
A work-around: Wrap the output of ErrorListPlot with Show using the option PlotRange -> All:

Show[elp, PlotRange -> All]

Mathematica graphics

$\endgroup$

Your Answer

By clicking “Post Your Answer”, you agree to our terms of service and acknowledge you have read our privacy policy.

Not the answer you're looking for? Browse other questions tagged or ask your own question.