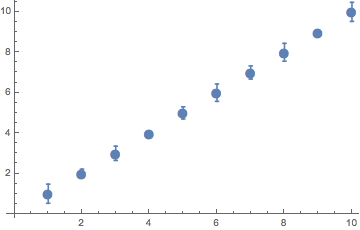
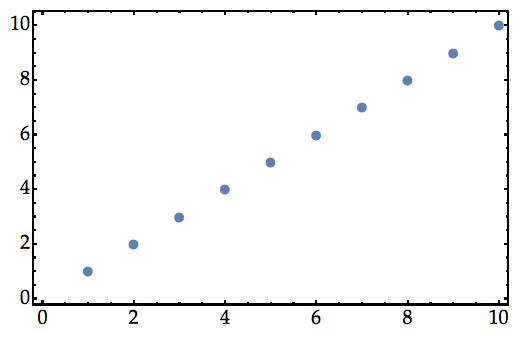
tl;dr: This is a known incompatibility between ErrorListPlot and PlotMarkers and there is a fix in an upcoming release. There is a workaround, though.
This is too long for a comment. When diagnosing an issue, an attempt should be made to break this down into a minimal example. First, I would ensure that it works without the additional options present, i.e. temporarily disable your init.m file.
ErrorListPlot[Table[{i, RandomReal[0.5]}, {i, 10}]]
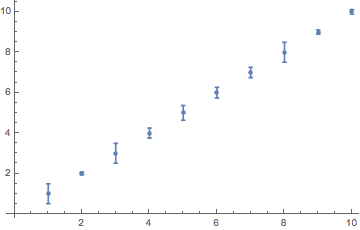
Second, test if ErrorListPlot is effected by setting the options on ListPlot or ListLinePlot:
Internal`InheritedBlock[{ListPlot},
 SetOptions[ListPlot, Frame -> True];
 ErrorListPlot[Table[{i, RandomReal[0.5]}, {i, 10}]]
]
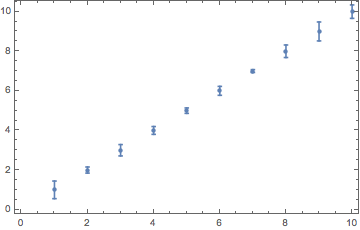
which appears it does. But, as you can see it's not the Frame. So, we need to work through what option actually does it. I like Association for this, and it is simpler if we run this against ErrorListPlot directly:
Association[
 First[#] -> ErrorListPlot[
     Table[{i, RandomReal[0.5]}, {i, 10}], #] & /@
  {Frame -> True,
   FrameTicks -> Automatic,
   FrameTicksStyle -> Directive[Automatic, 15], Axes -> False,
   BaseStyle -> {FontFamily -> "Palatino", 15},
   FrameStyle -> Directive[Black, 20, Thickness -> 0.0025],
   FrameTicksStyle -> Plain, ImageSize -> 500, ImageMargins -> 10,
   PlotMarkers -> {Automatic, 15}}]
I'm not going to include the output of the whole thing here as the issue is PlotMarkers.
ErrorListPlot[Table[{i, RandomReal[0.5]}, {i, 10}], PlotMarkers -> {Automatic, 15}]
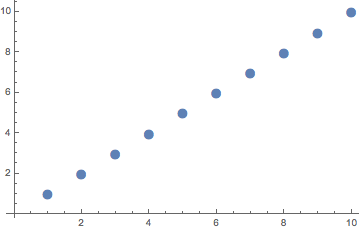
PlotMarkers is implemented by using GeometricTransformation which describes how to position the markers using only a single copy of the plot marker. It is a space saving device.
In[21]:= Cases[ErrorListPlot[Table[{i, RandomReal[0.5]}, {i, 10}],
  PlotMarkers -> {Automatic, 15}], _GeometricTransformation, -1]

(*Out[21]=
{GeometricTransformation[{Inset[Style["\[FilledCircle]", FontSize -> 15], {0., 0.}], {}},
{{{1., 1.}}, {{2., 2.}}, {{3., 3.}}, {{4., 4.}}, {{5., 5.}}, {{6., 6.}}, {{7., 7.}},
{{8., 8.}}, {{9., 9.}}, {{10., 10.}}}]}*)
At issue is that ErrorListPlot does not know how to work with GeometricTransformation. Also, there is not a simple way to patch the issue short of modifying the package directly, partially because Normal does not expand GeometricTransformation (another known issue). The issue with ErrorListPlot is being addressed in an upcoming release.
In the meantime, a workaround is to lay one plot on top of the other to "simulate" the effect, e.g.
With[{data = Table[{i, RandomReal[0.5]}, {i, 10}]},
 Show[ErrorListPlot[data, PlotMarkers -> {Automatic, 15}],
  ErrorListPlot[data]]
 ]
