3
$\begingroup$

I want to combine a few LisPlots in one Plot, but since all values are negative and there is no positive y-Axis, it looks weird, if th y-axis label is on the edge(you dont know where the label belongs to). So I wanted to put the label at the sides of the axis rather than at the end with this

Show[
 Labeled[ListPlot[DataCauchy1mA, Joined -> True, 
   PlotRange -> {{0, 1}, {-70, -30}}],  {"V in mV", "T in s"}, {Left, 
   Top}, RotateLabel -> True ],
 Labeled[ListPlot[DataCauchy5mA, Joined -> True, 
   PlotRange -> {{0, 1}, {-70, -30}}],  {"V in mV", "T in s"}, {Left, 
   Top}, RotateLabel -> True ]
 ]

But it is not working, saying that "Labeled is not a Graphics primitive or directive"

$\endgroup$
1
  • $\begingroup$ Based on that error message, you can't combine different Labeled objects, since Head@Labeled[Plot[x, {x, -3, 3}], "plot label"] gives Labeled. Try another method to label the plots, like Text or Inset $\endgroup$
    – Jason B.
    Commented Jul 5, 2016 at 19:50

3 Answers 3

1
$\begingroup$

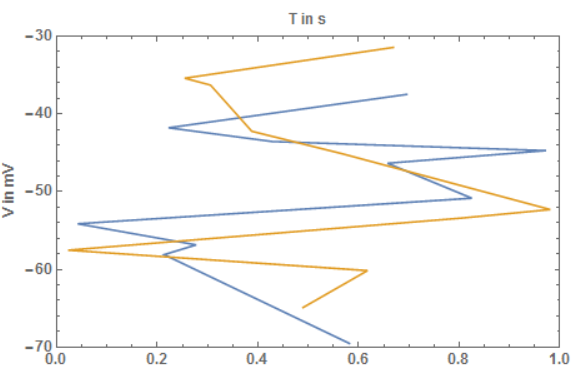
Since your DataCauchy1mA is precious

f := SortBy[
  Flatten[RandomReal[#, {5, 2}] & /@ {{0, 1}, {-70, -30}}, {3, 2}], 
  Last]
{DataCauchy1mA, DataCauchy2mA} = {f, f};

I mean we can don't use Show to do this

Labeled[ListPlot[{DataCauchy1mA, DataCauchy2mA}, Joined -> True, 
  PlotRange -> {{0, 1}, {-70, -30}}], {"V in mV", "T in s"}, {Left, 
  Top}, RotateLabel -> True]

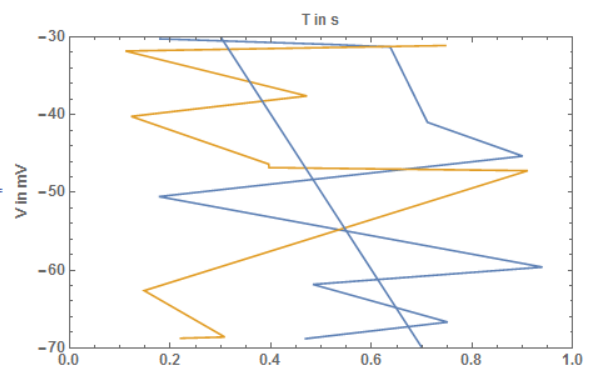
Or

ListPlot[{DataCauchy1mA, DataCauchy2mA}, Joined -> True, 
 PlotRange -> {{0, 1}, {-70, -30}}, Frame -> True, 
 FrameLabel -> {{"V in mV", None}, {None, "T in s"}}, 
 LabelStyle -> Directive[Bold, Medium]]

As the comment:

Notice this code is run normally

ListPlot[{DataCauchy1mA, DataCauchy2mA}, Joined -> True, 
  PlotRange -> {{0, 1}, {-70, -30}}, Frame -> True, 
  FrameLabel -> {{"V in mV", None}, {None, "T in s"}}, 
  LabelStyle -> Directive[Bold, Medium]]~Show~
 Plot[-100 x, {x, 0, 1}, PlotRange -> {{0, 1}, {-70, -30}}]

$\endgroup$
2
  • $\begingroup$ Thanks, that worked in my case right now, the only thing would be, what to do if we had the same problem, just with lets say a ListPlot and a normal Plot, so we cant use just one ListPlot $\endgroup$ Commented Jul 5, 2016 at 20:07
  • 1
    $\begingroup$ @LucaThiede See edit $\endgroup$
    – yode
    Commented Jul 5, 2016 at 20:14
2
$\begingroup$

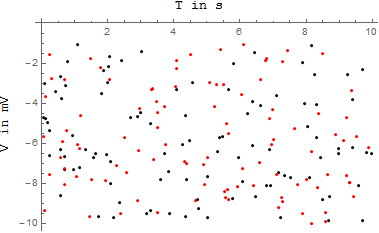
Wrap the Show within a Labeled.

data1 = Transpose@
   Join[{RandomReal[{0, 10}, 100], RandomReal[{-10, -1}, 100]}];

data2 = Transpose@
   Join[{RandomReal[{0, 10}, 100], RandomReal[{-10, -1}, 100]}];

Labeled[
 Show[
  ListPlot[data1, PlotStyle -> Black],
  ListPlot[data2, PlotStyle -> Red]
  ],
 {"V in mV", "T in s"},
 {Left, Top},
 RotateLabel -> True
 ]

Mathematica graphics

$\endgroup$
1
$\begingroup$

I have just worked my way through a similar problem with Grid, so I have a handy solution (more on this below.) The solution is rather crude; I just grab the graphics from within the Labeled wrappers and reassemble:

ClearAll[showWithin]; 
showWithin[first:Labeled[_Graphics, args___], rest:Labeled[_Graphics, ___]..., 
   opts:OptionsPattern[]] := 
  Activate[Labeled[(Inactive[Show][##1, FilterRules[{opts}, 
     Except[Options[Labeled]]]] & )[Query[All, 1][{first, rest}]], args]]

Taking a cue from Show, only the labeling of the first item is used, and subsequent labels are ignored.

f := SortBy[Flatten[(RandomReal[#1, {5, 2}] & ) /@ {{0, 1}, {-70, -30}}, {3,2}], Last]
{DataCauchy1mA, DataCauchy5mA} = {f, f}; 

showWithin[
Labeled[ListPlot[DataCauchy1mA, Joined -> True, 
PlotRange -> {{0, 1}, {-70, -30}}], {"V in mV", "T in s"}, {Left, Top}, 
RotateLabel -> True], 
Labeled[ListPlot[DataCauchy5mA, Joined -> True, 
PlotRange -> {{0, 1}, {-70, -30}}], {"V in mV", "T in s"}, {Left, Top}, 
RotateLabel -> True]
]
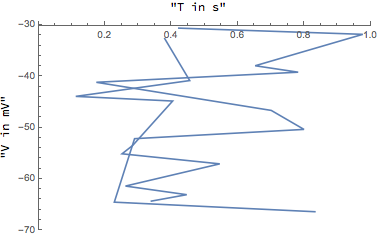
Outputgraphics

The original problem I was working is similar in making Show work within a Grid

ClearAll[GridShow]; 
GridShow::usage := "GridShow[g1,g2,...] shows several grids of graphics combined. Grids \
of the same dimensions may be combined, or Rows and Columns of the same length."; 
GridShow::argm = General::argm; 
SyntaxInformation[GridShow] = SyntaxInformation[Show]; 

GridShow[] := Message[GridShow::argm, "GridShow", 0, 1]; 

GridShow[first:Grid[{{__Graphics}..}, args___], rest:Grid[{{__Graphics}..}, ___]..., 
opts:OptionsPattern[]] := 
Activate[Grid[MapThread[Inactive[Show][##1, FilterRules[{opts}, 
     Except[Options[Grid]]]] & , Query[All, 1][{first, rest}], 2], 
 FilterRules[{opts, args}, Options[Grid]]]]; 

GridShow[first:(Column | Row)[{__Graphics}, args___], 
rest:(Column | Row)[{__Graphics}, ___]..., opts:OptionsPattern[]] := 
Activate[Head[first][MapThread[Inactive[Show][##1, FilterRules[{opts}, 
     Except[Options[Head[first]]]]] & , Query[All, 1][{first, rest}], 1], 
 FilterRules[{opts, args}, Options[Head[first]]]]]; 

Well, you can see where this could go. It is simple but laborious to go through and write a new function for every wrapper that could go around Graphics so we could thread Show across the interior structure. Can anybody suggest a more general approach?

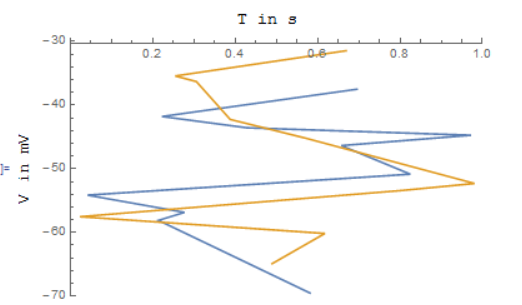
$\endgroup$

Your Answer

By clicking “Post Your Answer”, you agree to our terms of service and acknowledge you have read our privacy policy.

Not the answer you're looking for? Browse other questions tagged or ask your own question.