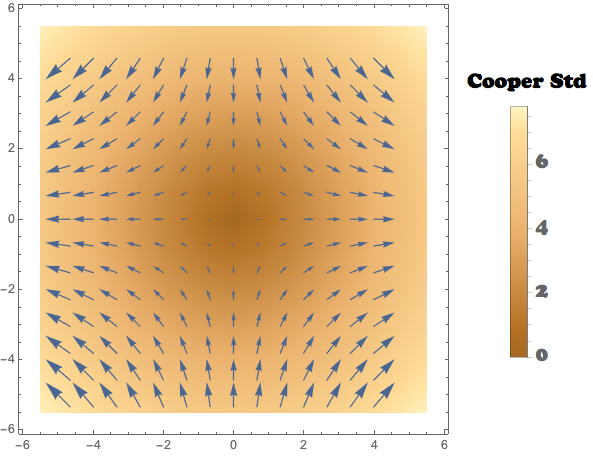
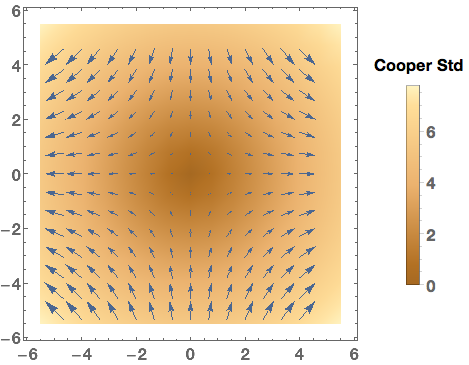
I have this:
VectorDensityPlot[{x, -y}, {x, -5, 5}, {y, -5, 5},
 PlotLegends -> Automatic]
and want to:
1) Add a label to the column bar legend on the side 2) Change the font size and style to Latin Modern Roman (LaTeX).
I managed to increase the font size with FrameTicks, but not the style. There aren't many examples around with VectorDensityPlot... I found loads for plot alone, but most of them don't work on VectorDensityPlot...


BaseStyleoption, give that a try. $\endgroup$