3
$\begingroup$

Probably not the right site to ask this, but how can I find out the Quandl codes for different commodities? For example, gold against USD? Tried "CURRFX/XAUUSD", but no joy. Here is the code for plotting GBP against USD:

DateListPlot[
  Rest @ 
    QuandlFinancialData["CURRFX/USDGBP", 
      startDate -> "2016-6-1", endDate -> "2016-6-23", column -> 2], 
  ImageSize -> 400]
$\endgroup$
4
  • 2
    $\begingroup$ Would something like this free Quandl database link to the World Gold Council (quandl.com/data/WGC) work for you? The code seems to be "WGC/GOLD_DAILY_USD". I found that through their database browser. $\endgroup$
    – MarcoB
    Commented Jun 24, 2016 at 14:08
  • $\begingroup$ @MarcoB It works - thanks :) $\endgroup$
    – martin
    Commented Jun 24, 2016 at 14:16
  • $\begingroup$ You're welcome! Would you mind putting together a quick self-answer, pointing to the QuandlLink` package, and to the database browser as well, for future reference? This could be very useful for future searchers! $\endgroup$
    – MarcoB
    Commented Jun 24, 2016 at 14:21
  • $\begingroup$ @MarcoB will do $\endgroup$
    – martin
    Commented Jun 24, 2016 at 14:23

3 Answers 3

4
$\begingroup$

Answer posted for the benefit of future users of the Quandl package for MMA by Anmol Bajracharya, also described in this Wolfram Community post.

Thanks to @MarcoB's search through Quandl's database browser, he found a link to the World Gold Council. Using the code "WGC/GOLD_DAILY_USD" works in this case:

<< QuandlLink`

DateListPlot[
  Rest@ 
    QuandlFinancialData[
      "WGC/GOLD_DAILY_USD", 
      startDate -> "2016-6-1", endDate -> "2016-6-23", 
      column -> 2
    ], 
   ImageSize -> 400
 ]

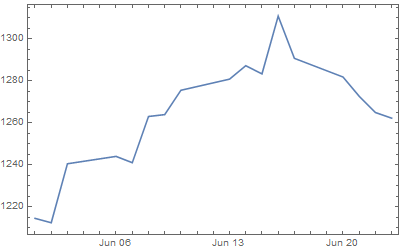
produces:

timeline plot of gold price in USD in June 2016

$\endgroup$
1
  • 1
    $\begingroup$ Martin Thanks for drafting this. $\endgroup$
    – MarcoB
    Commented Jun 24, 2016 at 18:14
2
$\begingroup$

Slight modification to martin's answer to address recent changes in Ma.

QuandlOneSeries[symbol_, stDate_, endDate_] := Module[{data, dates, datav, datats},
  data = Import[StringJoin["https://www.quandl.com/api/v3/datasets/", symbol, 
     "/data.csv?start_date=", stDate, "&end_date=", endDate, 
     "&order=asc"]];
  dates = ToExpression[StringSplit[data[[2 ;;, 1]], "-"]];
  datav = data[[2 ;;, 2]];
  datats = TimeSeries[datav, {dates}];
  Return[datats]]

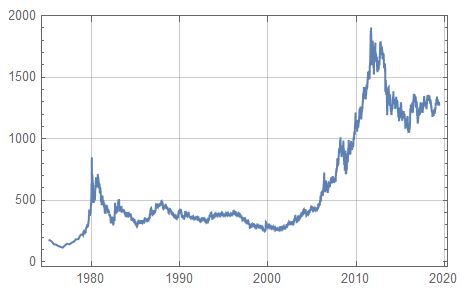
Using above function, data can be downloaded and DateListPlot can be used to plot it as follows:

DateListPlot[QuandlOneSeries["WGC/GOLD_DAILY_USD", "1975-03-31", "2019-05-31"],
GridLines -> Automatic]

enter image description here

$\endgroup$
1
$\begingroup$

Alternatively, get an API key from here (free), and use something like the following:

quandl[dataset_, startdate_, enddate_, apikey_] := 
Import[StringJoin["https://www.quandl.com/api/v3/datasets/", 
dataset, ".json?api_key=", apikey, "&start_date=", startdate, 
"&end_date=", enddate]][[1, 2, 6, 2]];

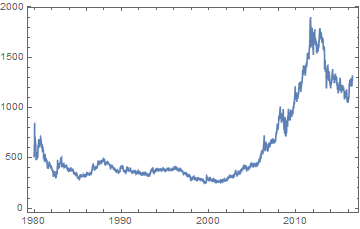
which gives

DateListPlot[quandl["WGC/GOLD_DAILY_USD", "1980-01-01", "2016-06-24", 
(*your API key*)]]

enter image description here

$\endgroup$

Your Answer

By clicking “Post Your Answer”, you agree to our terms of service and acknowledge you have read our privacy policy.

Not the answer you're looking for? Browse other questions tagged or ask your own question.