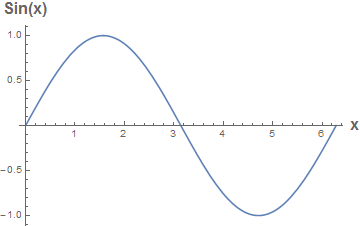
I have a plot expression that looks something like this:
LogPlot[
 {f[x], g[x]}, {x, 0, 1000},
 Frame -> {True, True, False, False},
 FrameLabel -> {"x axis", "y axis"},
 FrameTicks -> {
   Automatic,
   Table[{10^i, Superscript["10", ToString[i]]}, {i, 2, 6}]},
 PlotLegends -> Placed[{"f(x)", "g(x)"}, {.2, .8}]
]
I want to increase the size of the axes labels without changing the size of the tick labels or the legends. The only advice I can find on this issue doesn't seem to work when using a Frame. Any ideas?

