0
$\begingroup$

The Issue

I am trying to specify the number of clusters and the number of members in each cluster that the CommunityGraphPlot function forms as part of a larger project.

The Code

This code generates a complete graph with a random edge weight between 0 and 1 assigned between each node. It then outputs a community graph plot, choosing communities based on some algorithm.

n = 10;
q = n * (n - 1)/2;
g = CompleteGraph[n, EdgeWeight -> RandomReal[{0, 1}, {q}]];
FindGraphCommunities[g];
CommunityGraphPlot[g, 
 Method -> "Hierarchical",(*EdgeLabels\[Rule]"EdgeWeight",*) 
 ImageSize -> Full]

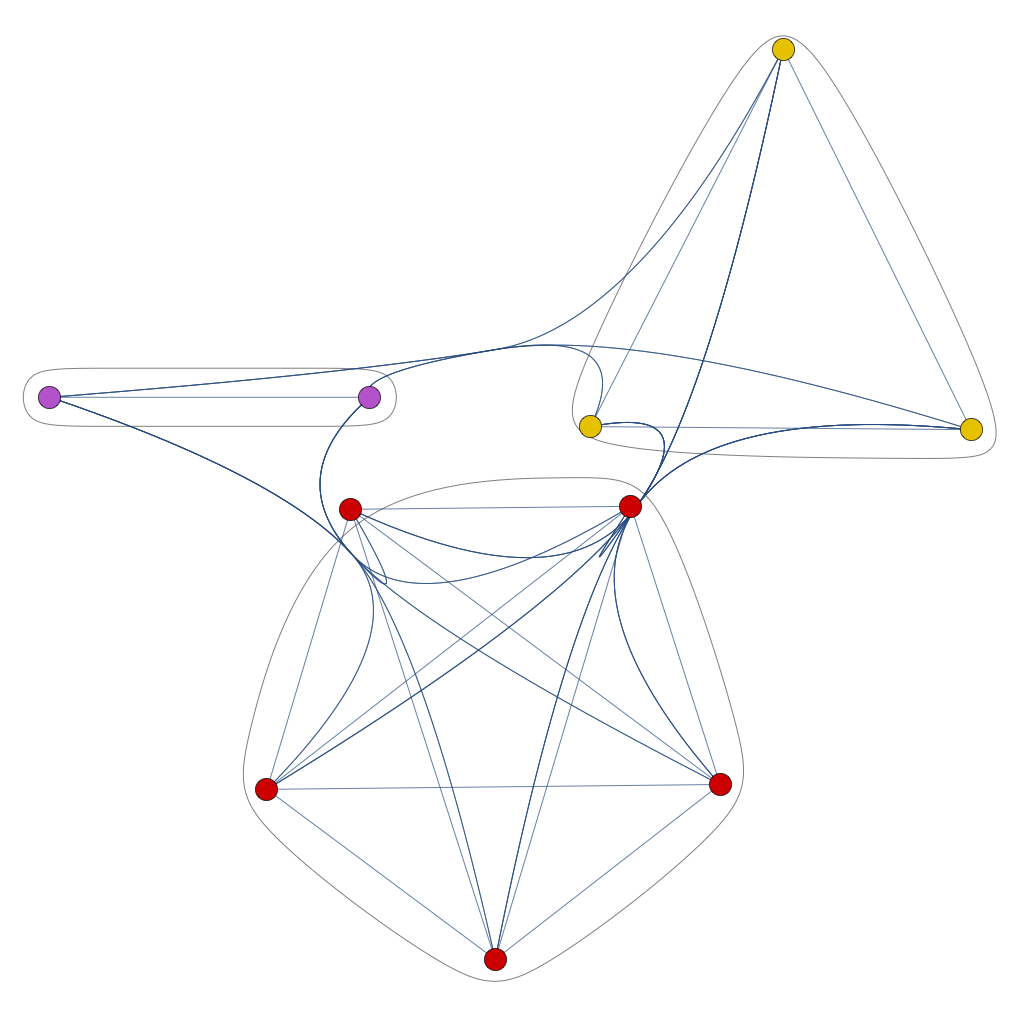
The output plot

The Question

This function is something of a black box, and while reviewing the documentation, I was unable to find any options to specify how many clusters it forms, or how many members are in each cluster. Are there workarounds to this issue?

Also I would appreciate if anyone could point me towards any literature on the methods used to choose clusters, or any other functions that could be used to specify the number of clusters, etc.

Thank you.

$\endgroup$

1 Answer 1

5
$\begingroup$
CommunityGraphPlot[g] 

will find community based on

FindGraphCommunities[g]

So that

CommunityGraphPlot[g]

is the same as

CommunityGraphPlot[g, FindGraphCommunities[g]]

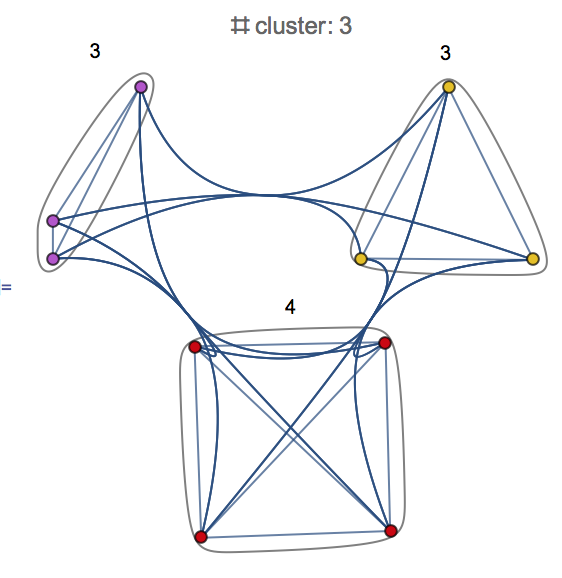
You could put labels like the following to show # of members:

n = 10;
q = n*(n - 1)/2;
g = CompleteGraph[n, EdgeWeight -> RandomReal[{0, 1}, {q}]];
com = FindGraphCommunities[g];
member = Length /@ com;
CommunityGraphPlot[g, com, Method -> "Hierarchical", 
 CommunityLabels -> member, ImageSize -> Full, 
 PlotLabel -> "# cluster: " <> ToString[Length[com]]]

labeled community graph

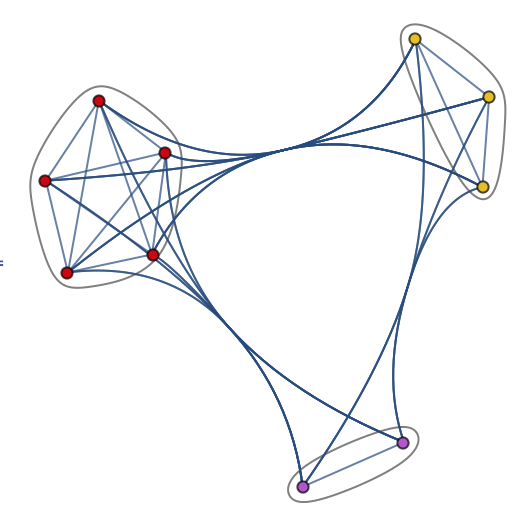
For controlling size of cluster, FindGraphPartition can be useful. For example, find the partition of 3 clusters with {5, 3, 2} members.

n = 10;
q = n*(n - 1)/2;
g = CompleteGraph[n, EdgeWeight -> RandomReal[{0, 1}, {q}]];
comm = FindGraphPartition[g, {5, 3, 2}] 
{{2, 4, 5, 8, 9}, {1, 6, 7}, {3, 10}}

and use this set to visualize the result with CommunityGraphPlot:

CommunityGraphPlot[g, comm]

community graph

$\endgroup$
5
  • $\begingroup$ Thank you for your informative answer. However, I don't think you answered my question. $\endgroup$ Commented Jun 8, 2016 at 16:26
  • 1
    $\begingroup$ Which part you didn't get it? $\endgroup$
    – halmir
    Commented Jun 8, 2016 at 17:14
  • $\begingroup$ Maybe I should rephrase my question, but I am looking for an option in the function that allows me to specify how many clusters the function will form, as well as allow me to specify how many members are in each one of the clusters. I want to be able to specify these things in the argument to CommunityGraphPlot. $\endgroup$ Commented Jun 8, 2016 at 17:17
  • 6
    $\begingroup$ There are no such options in CommunityGraphPlot, but you can put any set of lists as second argument. You might want to check FindGraphPartition. $\endgroup$
    – halmir
    Commented Jun 8, 2016 at 18:21
  • $\begingroup$ Ok, upon closer review of your answer, I do believe you've addressed all parts of my question fully. Thank you very much! $\endgroup$ Commented Jun 9, 2016 at 12:54

Your Answer

By clicking “Post Your Answer”, you agree to our terms of service and acknowledge you have read our privacy policy.

Not the answer you're looking for? Browse other questions tagged or ask your own question.