4
$\begingroup$

I can plot the intersection line of two surfaces $f$, $g$ by using:

ContourPlot3D[
  f[x, y, z] == 0, 
  MeshFunctions -> {Function[{x, y, z, f}, f[x, y, z] - g[x, y, z]]}
]

But I need to do some calculations based on the intersection line. Or I need 100 (for example) group data of $(x, y, z)$ on the line. How can I do this?

$\endgroup$
2
  • $\begingroup$ Have you seen Equation for the line of intersection between two planes $\endgroup$
    – user9660
    Commented Apr 29, 2016 at 17:00
  • $\begingroup$ yes, but the equation of f,g is complicated, there is no simple line equation of the intersection line. $\endgroup$
    – Qi Zhong
    Commented Apr 30, 2016 at 19:50

3 Answers 3

7
$\begingroup$

I'm not sure what kinds of calculations you'll want to do on the intersection line; but to get a sample of points on the intersection line, you could use DiscretizeRegion and MeshCoordinates:

f[x_, y_, z_] = x^4 + y^4 + z^4 - 1;
g[x_, y_, z_] = x - 2 y + z - 2;
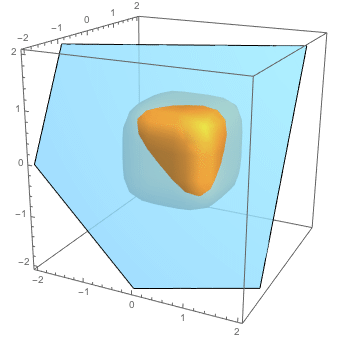
ContourPlot3D[{f[x, y, z] == 0, g[x, y, z] == 0}, {x, -2, 2}, {y, -2, 2}, {z, -2, 2}, ContourStyle -> Opacity[0.8], Mesh -> None]

enter image description here

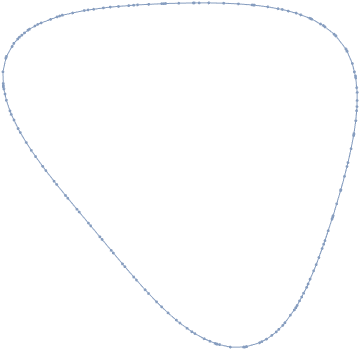
reg = DiscretizeRegion[ImplicitRegion[{f[x, y, z] == 0, g[x, y, z] == 0}, {x, y, z}]]

enter image description here

MeshCoordinates[reg]

(* {{0.327426, -0.339412, 0.99375}, {0.327446, -0.339402, 0.99375}, ... } *)

In this example, I get 176 points along the intersection curve using the default settings for each function. If your initial results contain too few (or too many) points, you could try tweaking the MaxCellMeasure option when you use the DiscretizeRegion function.

$\endgroup$
2
5
$\begingroup$

For version 9:

f[x_, y_, z_] := x^3 + y^2 - z^2
g[x_, y_, z_] := x^2 + y^2 + z^2 - 1
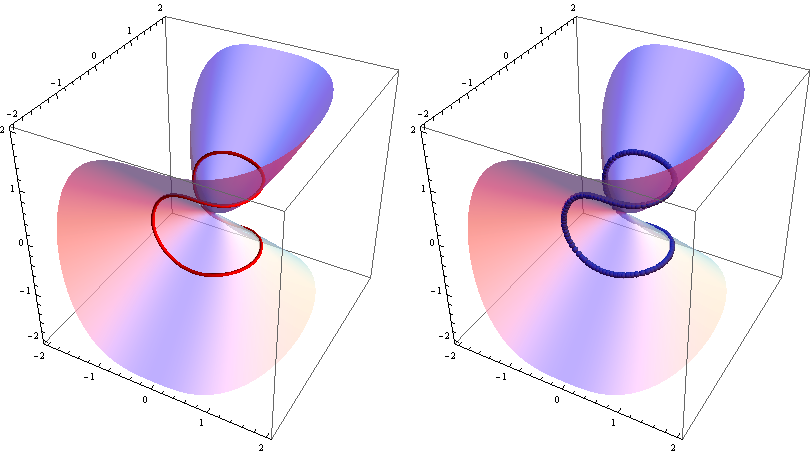
cp3d = ContourPlot3D[{f[x, y, z]==0, g[x, y, z]==0}, {x, -2, 2}, {y, -2, 2}, {z, -2, 2}, 
  BoundaryStyle -> {1 -> None, 2 -> None, {1, 2} -> {Thick, Red}}, 
  ContourStyle -> Opacity[.7], Mesh -> None, ImageSize -> 400];
points =  Cases[Normal@cp3d, Line[x_] :> x, Infinity][[1]];
Length@points

121

lpp3d = ListPointPlot3D[points, PlotStyle->PointSize[Large]]/. Point -> (Sphere[#, .05] &);

Row[{cp3d /. Line -> Tube, Show[cp3d, lpp3d]}, Spacer[5]]
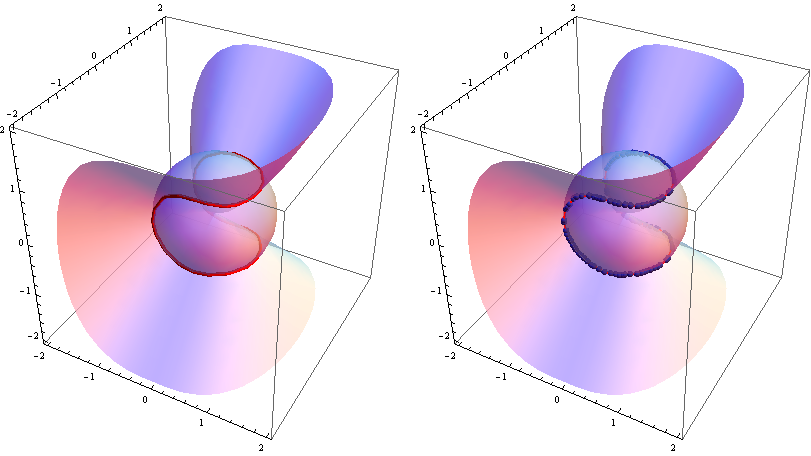
Mathematica graphics

Alternatively, using MeshFunctions

cp3d2 = ContourPlot3D[f[x, y, z] == 0, {x, -2, 2}, {y, -2, 2}, {z, -2, 2}, 
   PlotPoints -> 50, ImageSize -> 400, BoundaryStyle -> None, 
   ContourStyle -> Opacity[.7], MeshStyle -> {Red, Thick}, 
   Mesh -> {{0}}, MeshFunctions -> {Function[{x, y, z}, f[x, y, z] - g[x, y, z]]}];
points2 = Cases[Normal@cp3d2, Line[x_] :> x, Infinity][[1]];
Length@points2

201

lpp3d2 = ListPointPlot3D[points2, PlotStyle -> PointSize[Large]] /. 
   Point -> (Sphere[#, .05] &);

Row[{cp3d2 /. Line -> Tube, Show[cp3d2, lpp3d2]}, Spacer[5]]
Mathematica graphics

$\endgroup$
3
$\begingroup$

Here are two additional approaches, one uses RegionIntersection, the other uses DiscretizeGraphics:

f[x_, y_, z_] = x^4 + y^4 + z^4 - 1;
g[x_, y_, z_] = x - 2 y + z - 2;

regF = ImplicitRegion[f[x, y, z] == 0, {x, y, z}];
regG = ImplicitRegion[g[x, y, z] == 0, {x, y, z}];

reg = DiscretizeRegion @ RegionIntersection[regF, regG]

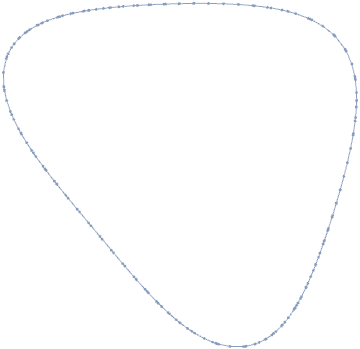
Mathematica graphics

MeshCoordinates @ reg // Length

235

Method 2

gr = ContourPlot3D[{f[x, y, z] == 0, g[x, y, z] == 0}, {x, -2, 2}, {y, -2, 2}, {z, -2, 2}, 
     ContourStyle -> Directive[Green, Opacity[0.5], Specularity[White, 30]], 
     BoundaryStyle -> {1 -> None, 2 -> None, {1, 2} -> Red}, 
     Mesh -> None, PlotPoints -> 40];

reg = DiscretizeGraphics[gr, Line];
MeshCoordinates @ reg // Length

107

$\endgroup$

Not the answer you're looking for? Browse other questions tagged or ask your own question.