I am trying to combine three separated curves into a same figure. The codes are inspired by another post and answers here.
Codes:
snip[pos_] :=
  Arrowheads[{{Automatic, pos,
     Graphics[{BezierCurve[{{0, -(1/2)}, {1/2, 0}, {-(1/2), 0}, {0,
          1/2}}]}]}}];

data1 = {{1, 1.1}, {2, 1.5}, {3, 0.9}, {4, 2.3}, {5, 1.1}};
data2 = {{1, 1001.1}, {2, 1001.5}, {3, 1000.9}, {4, 1002.3}, {5,
    1001.1}};
data3 = {{1, 8001.1}, {2, 8001.5}, {3, 8000.9}, {4, 8002.3}, {5,
    8001.1}};

getMaxPadding[p_List] :=
 Map[Max, (BorderDimensions@
        Image[Show[#, LabelStyle -> White, Background -> White]] & /@
      p)~Flatten~{{3}, {2}}, {2}] + 1

p1 = ListPlot[data1, PlotRange -> All, Joined -> True, Mesh -> Full,
   PlotStyle -> Red,
   AxesStyle -> {{Arrowheads[.035], Directive[Black, 12]}, {snip[1],
      Directive[Black, 12]}}, PlotRangePadding -> .2,
   ImagePadding -> {{50, 5}, {15, 5}}, AspectRatio -> 1/3];

p2 = ListPlot[data2, PlotRange -> All, Joined -> True, Mesh -> Full,
   PlotStyle -> Blue, Axes -> {False, True},
   AxesStyle -> {{None}, {snip[0], Directive[Black, 12]}},
   PlotRangePadding -> .2, ImagePadding -> {{50, 15}, {5, 5}},
   AspectRatio -> 1/3];

p3 = ListPlot[data3, PlotRange -> All, Joined -> True, Mesh -> Full,
   PlotStyle -> Magenta, Axes -> {False, True},
   AxesStyle -> {{None}, {snip[0], Directive[Black, 12]}},
   PlotRangePadding -> .2, ImagePadding -> {{50, 15}, {5, 5}},
   AspectRatio -> 1/3];

output = Column[{p3, p2, p1} /.
   Graphics[x__] :>
    Graphics[x, ImagePadding -> getMaxPadding[{p1, p2, p3}],
     ImageSize -> 500]]
Export["testBrokenAxiesFigure.png", output]
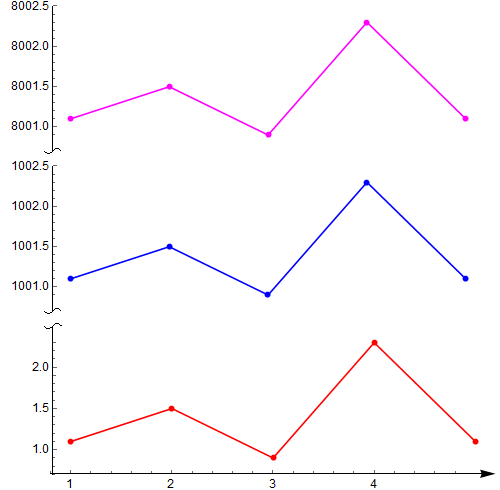
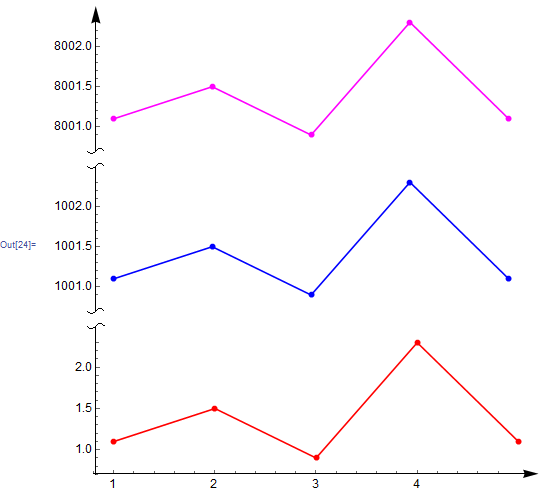
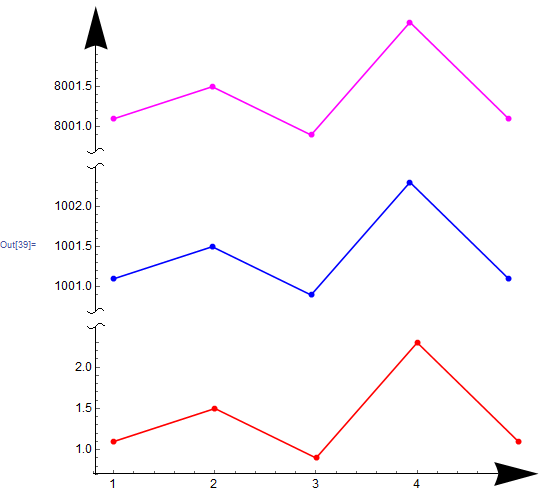
and output are:
How can I add an additional arrow to the vertical axis of the figure?
And how can I change the
single Bezier curve separation symbol(at 1002.5 on the vertical axis) into adouble Bezier curve symbollike that at about 2.5 on the vertical axis?


