0
$\begingroup$

I want to plot x = u Cos[Phi] + v Cos[(u Phi)/v] and y = u Sin[Phi] - v Sin[(u Phi)/v]in a parametric graph for u = 3 and v = 5. This is my command:

ParametricPlot[{x, y} /. {u -> 3, v -> 5}, {Phi, 0, 2 Pi}, 
 PlotRange -> All]

I think it was supposed to show two circles and it's not.

Also, for the same u and v values, if the angular velocity of the inner circle about its own center is 0.1 rad/sec, and the time taken for an arbitrary initial contact point to return to the same con figuration.

$\endgroup$
2
  • 1
    $\begingroup$ Definitely not a circle. $\endgroup$
    – march
    Commented Apr 15, 2016 at 5:31
  • $\begingroup$ Hmm that's what I thought too. But then the problem asks what are the radii for the inner and outer circles so I'm not sure $\endgroup$
    – Ccyan
    Commented Apr 15, 2016 at 5:40

1 Answer 1

2
$\begingroup$
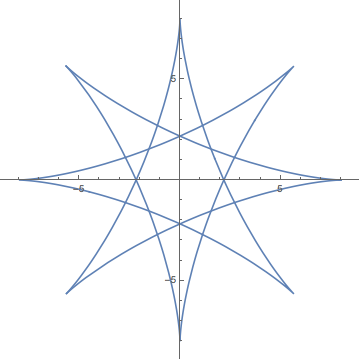
p1 = ParametricPlot[{x, y} /. {u -> 3, v -> 5}, {Phi, 0, 10 \[Pi]}, 
PlotRange -> All]

enter image description here

v=2;

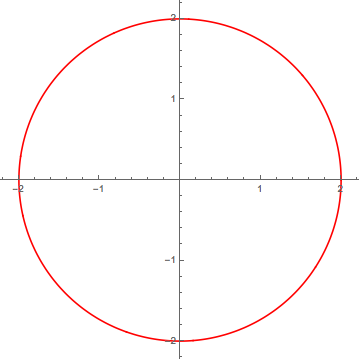
p2 = ParametricPlot[{v Cos[u], v Sin[u]}, {u, 0, 2 Pi}, 
PlotStyle -> Directive[Red, Opacity[1]]]

enter image description here

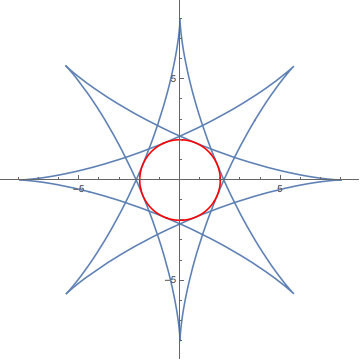
Show[p1, p2]

enter image description here

but do the Math by your self, because there are other circles

Edit - some sources and infos:

Parametric Equations

Natural Parametric Equations

Circle

How to | Plot Parametric Functions

How to | Create Plots

Have Fun!

$\endgroup$
1
  • $\begingroup$ What do you mean other circles? And why did you use sin and cos to get the circle? I really don't get this $\endgroup$
    – Ccyan
    Commented Apr 15, 2016 at 6:04

Your Answer

By clicking “Post Your Answer”, you agree to our terms of service and acknowledge you have read our privacy policy.

Not the answer you're looking for? Browse other questions tagged or ask your own question.