2
$\begingroup$

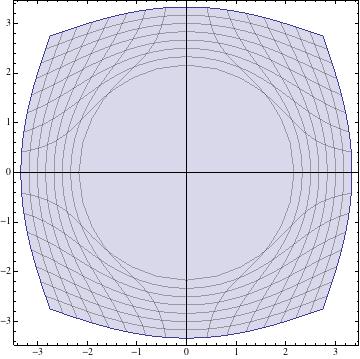
I currently have the following parametric plot.

ParametricPlot[{(b - a) x/b + a x/r, (b - a) y/b + a y/r} /. {a -> 2, 
   b -> 3}, {x, -4, 4}, {y, -4, 4}]

where r=Sqrt[x^2+y^2].

I am trying to plot this coordinate system only within the region

a < Sqrt[((b - a) x/b + a x/r)^2 + ((b - a) y/b + a y/r)^2] < b,

the region where Sqrt[((b - a) x/b + a x/r)^2 + ((b - a) y/b + a y/r)^2] > b should be cartesian.

I am unsure how to achieve this. Does anyone have a solution? I apologize if this has already been asked, but I couldn't find a previous question when I looked.

Cheers, Stephen

$\endgroup$
1
  • $\begingroup$ First place you look should be the documentation. There is a RegionFunction mentioned as an option for ParametricPlot. $\endgroup$
    – Kuba
    Commented Apr 4, 2016 at 12:14

1 Answer 1

5
$\begingroup$

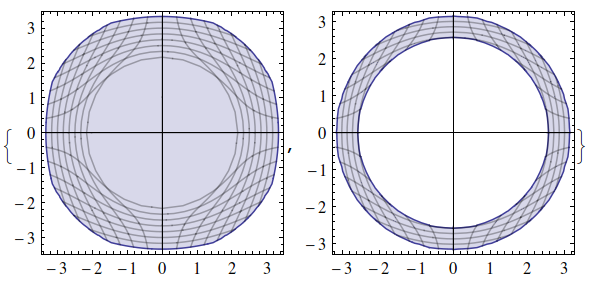
You need to use a RegionFunction . Based on the look of your plot, I assume you are using version 9, so that's what I'll use here. In version 10.3, the mesh lines look different.

Not sure which of these you are going for, whether you want, in the region definition, for x and y to refer to the Cartesian axes or the ParametricPlot parameters, so take your pick

ParametricPlot[{(b - a) x/b + a x/r, (b - a) y/b + a y/r}, {x, -4, 4}, {y, -4, 4}, 
   RegionFunction -> 
    Function[#,
      a < (((b - a) x/b + a x/(x^2 + y^2))^2 + ((b - a) y/b + 
            a y/(x^2 + y^2))^2) < b]] & /@ {{x, y, u, v}, {u, v, x, y}}

enter image description here

$\endgroup$

Your Answer

By clicking “Post Your Answer”, you agree to our terms of service and acknowledge you have read our privacy policy.

Not the answer you're looking for? Browse other questions tagged or ask your own question.