1
$\begingroup$

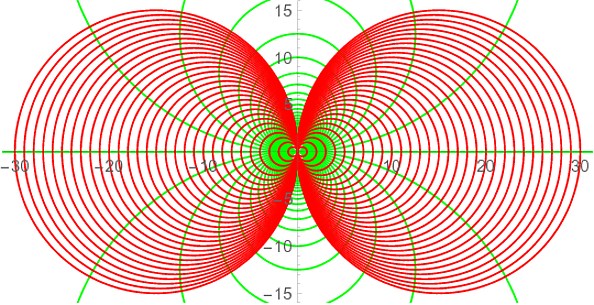
how can I plot the below green curve? Is there any way I could manipulate the step sizes?

enter image description here

This is my current code:

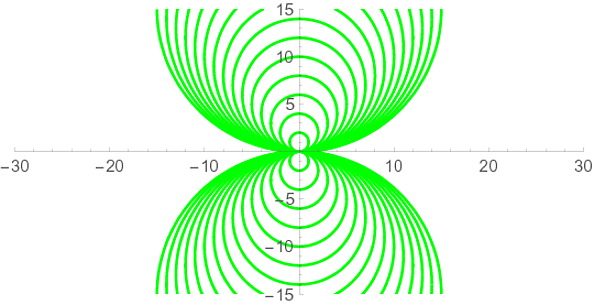
s1 = Plot[{Table[1/2 (c - Sqrt[c^2 - 4 x^2]), {c, -30, 30, 2}], 
Table[1/2 (c + Sqrt[c^2 - 4 x^2]), {c, -30, 30, 2}]}, {x, -30, 30},
PlotRange -> {{-30, 30}, {-15, 15}}, PlotStyle -> Green, 
AspectRatio -> Automatic]

enter image description here

Thank you in advance!

$\endgroup$

1 Answer 1

1
$\begingroup$

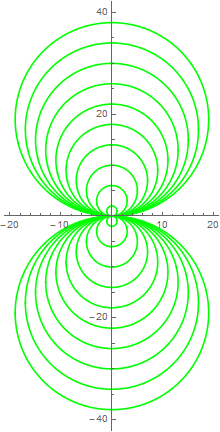
Perhaps:

ParametricPlot[
  Table[sign (i {Cos[x], Sin[x]} + {0, i}), {i, 1, 20, 2}, {sign, {-1, 1}}],
  {x, 0, 2 Pi},
  PlotStyle -> Green
]

Mathematica graphics

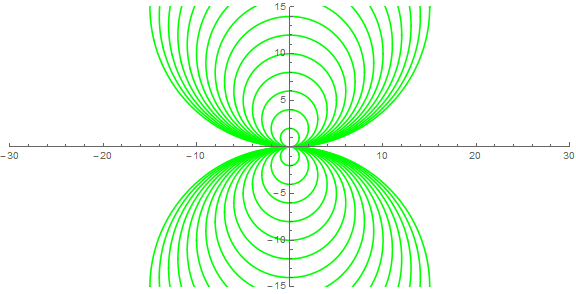
You can then adjust the PlotRange, the range of and pitch of the values of $i$ to your desired results:

ParametricPlot[
  Table[sign (i {Cos[x], Sin[x]} + {0, i}), {i, 1, 15, 1}, {sign, {-1, 1}}],
  {x, 0, 2 Pi},
  PlotStyle -> Green,
  PlotRange -> {{-30, 30}, {-15, 15}}, ImageSize -> Large
]

Mathematica graphics

$\endgroup$
1
  • $\begingroup$ Thank you for your answer. However, I need to keep the equations 1/2 (c - Sqrt[c^2 - 4 x^2]) 1/2 (c + Sqrt[c^2 - 4 x^2] as this is a math assignment. What I'm mainly looking for is to have plot evaluate the equation at a value of c that will make it a straight line across the x-axis (like in my above picture with the red and green curves) without it appearing messy. $\endgroup$
    – Alan
    Commented Mar 19, 2016 at 2:59

Your Answer

By clicking “Post Your Answer”, you agree to our terms of service and acknowledge you have read our privacy policy.

Not the answer you're looking for? Browse other questions tagged or ask your own question.