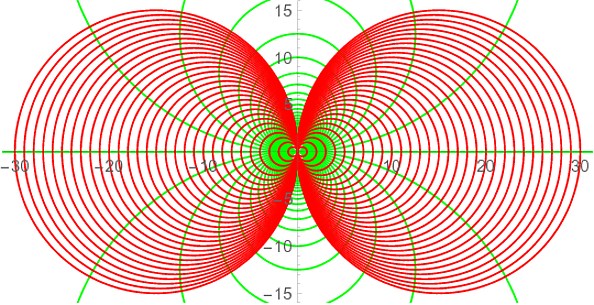
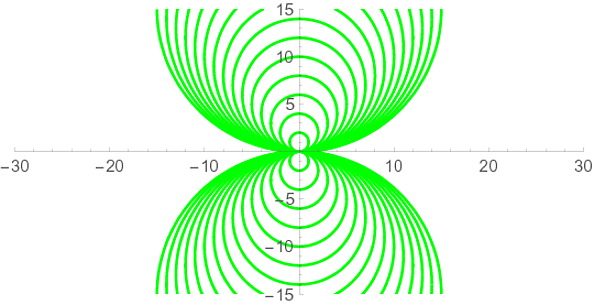
how can I plot the below green curve? Is there any way I could manipulate the step sizes?
This is my current code:
s1 = Plot[{Table[1/2 (c - Sqrt[c^2 - 4 x^2]), {c, -30, 30, 2}],
Table[1/2 (c + Sqrt[c^2 - 4 x^2]), {c, -30, 30, 2}]}, {x, -30, 30},
PlotRange -> {{-30, 30}, {-15, 15}}, PlotStyle -> Green,
AspectRatio -> Automatic]
Thank you in advance!


