70
$\begingroup$

This post is here to save your time during GUI development in Mathematica. And one way to do this is to know where limits are and to be aware of features that are awaiting.

Background

Usually I don't have to care (it hurts my brain though) about misaligned details, additional/missing pixels. But currently I'm participating in a project where the design matters and I have to follow examples made by a graphics designer. I have to workaround 10 "features" per hour, and I'm not talking about fancy stuff.

This is intended to be a cheat-sheet for GUI development, based on our experience.

What is on topic here

  • Links to guidelines making GUI creation process more stable, predictive.

  • Links to guidelines on how to achieve robust dynamic performance of GUI-s.

  • Links to known bugs and workarounds for GUI-related issues, preferably posted as separate Q&A threads.

  • Tips about communication with designer/manager about requirements.

    People are used to the fact that you can create very nice layout with css in no time. How to explain that it is impossible, or not worth the time spent, in Mathematica? How to explain why getting rid of "white line" in some secondary menu took me half a day, and I've failed?

$\endgroup$
23
  • 15
    $\begingroup$ For me the most disappointed thing is that most, if not all, of these problems have been documented for several years and several versions but WRI have made no attempt to fix them. Giving us feature bloat seems a higher priority than fixing bugs that could actually lead to useful uses of Mathematica. Speculating, I wonder if it doesn't get back to the WRI 100% focus on Manipulate and the demonstrations project and the "cool" stuff that can be done in the classroom at the expense of applications for commercial (internal) deployment $\endgroup$ Commented Mar 9, 2016 at 23:16
  • 13
    $\begingroup$ ...which in turn gets back to WRI having a negligible commercial footprint (lets face it SAS, R, SPSS, Python, Matlab, Tableau etc etc are kicking its ass in corporate environments) and sales % dominated by universities. $\endgroup$ Commented Mar 9, 2016 at 23:19
  • 5
    $\begingroup$ @QuantumDot source: me. If you have the time it is reasonably easy to put this together in a semi-quantitative way. Public companies have public accounts so you can readily find how much business they are doing. Private companies are more difficult. You need to rely on whatever revenue information they release and accept it as real. Revenue information is important not the number of users they claim they have. Everyone plays games. If a university has a site license then all students will be deemed to be users etc. Additionally you can correlate that info with job adds ... $\endgroup$ Commented Mar 12, 2016 at 0:37
  • 7
    $\begingroup$ @QuantumDot over the years I have found reasonable correlation between revenues and proportion of job ads requiring a certain software as a skill. For example when I worked at WRI Mathworks from memory had about 15-18 times WRI revenue and Mathcad had twice WRI revenue. Job ads were in reasonable agreement with those ratios. Since then I am in Australia so this market is my only concern. A former reseller here also sold Mathcad so I know that Mathcad sales exceed Mathematica. Job ads here Mathematica is very rarely mentioned. SPSS, SAS, python (numpy, pandas), R etc are desired skills ... $\endgroup$ Commented Mar 12, 2016 at 0:42
  • 5
    $\begingroup$ @QuantumDot as a final observation I use MongoDB more and more these days and in an ideal world Mathematica seems like a perfect program to accompany it because associations can be very Mongo like but Mongo is currently mostly used in web development I think which excludes Mathematica. Also Tableau have already got in there and established a relationship with Mongo for their BI connector ... $\endgroup$ Commented Mar 12, 2016 at 0:52

2 Answers 2

12
$\begingroup$

Things to keep in mind when developing complex GUI in Mathematica:


Wolfram System general issues:


FrontEnd / GUI construction specific issues

Major:

Minor

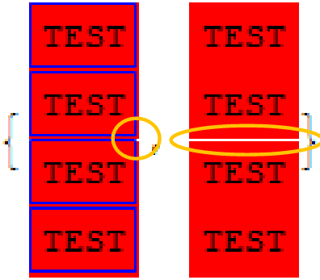
  • Misaligned frames, additional pixels, imprecise dimensions

    Extra pixels are introduced in many cases, leading to improper dimensions and misalignments.

    test = Framed["TEST", Background -> Red, FrameStyle -> Blue, ImageSize -> {100, 100}]
    

    Mathematica graphics

    test = Framed[   "TEST",   Background -> Red,   FrameStyle -> #  ] &;
    
    Column[{#, #, Column[{#, #}, Spacings -> 0]}, Spacings -> 0] & /@ {test[Blue], test[None]}
    

    enter image description here

    ImageDimensions@Rasterize@test
    
         {100, 102} (* I could live with {102, 102}... *)
    

    Grid cuts my images

    enter image description here

    TabView Alignment problem for content larger than a view area:

    enter image description here

  • Transparency and background issues

    Transparent bitmaps in controllers bug.

    Dynamic graphics appears first with wrong background

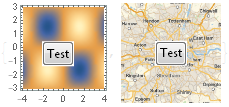
    DensityPlot and GeoGraphics put a white frame around an inset Button.

     {DensityPlot[Sin[x] Sin[y], {x, -4, 4}, {y, -3, 3}, ImageSize -> 100, 
      Epilog -> {Inset[Button["Test"], Background -> None]}],
      GeoGraphics["London", ImageSize -> 100, 
      Epilog -> {Inset[Button["Test"], Background -> None]}]}
    

    Mathematica graphics

Further problems

Notebook's WindowSize interference with contents' Dynamic ImageSizes

Problem with CurrentValue["MouseOver"] and Deploy


Kernel / coding style issues


OS dependent features

From my experience it is impossible to create precise GUI for Win and Mac. Not all features are OS dependent, and often workaround for one will give you headache in the other.

Grid layout problems: different sizes when rendering on Mac and Windows

Not needed Stylesheet locked by the FrontEnd


$\endgroup$
4
$\begingroup$

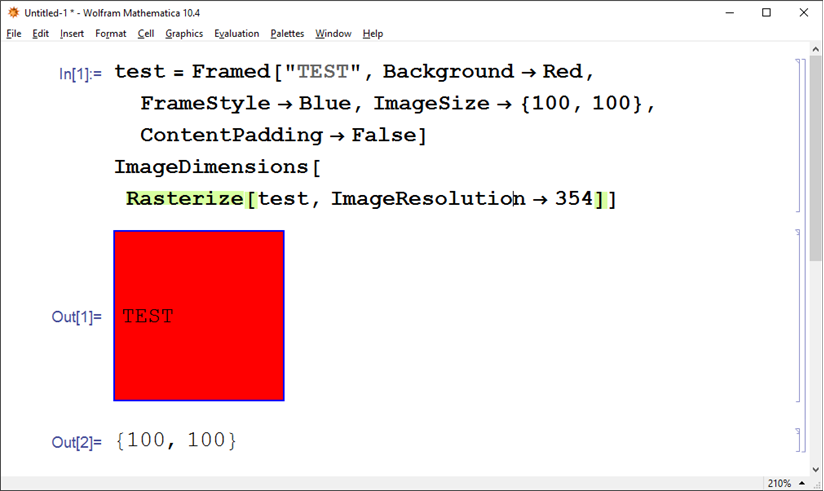
Regarding the lack of control of the output size, at least with a sufficiently high ImageResolution setting it can be tuned:

  test = Framed["TEST", Background -> Red, FrameStyle -> Blue, 
  ImageSize -> {100, 100}, ContentPadding -> False]
ImageDimensions[Rasterize[test, ImageResolution -> 354]]

enter image description here

$\endgroup$
1
  • 1
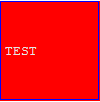
    $\begingroup$ This "feature", like some other problems, depends on the Magnification. You are using 210%. Using your code the problem still persists for me at 100%. Screen Snippet $\endgroup$
    – Karsten7
    Commented Jul 24, 2016 at 8:00

Your Answer

By clicking “Post Your Answer”, you agree to our terms of service and acknowledge you have read our privacy policy.

Not the answer you're looking for? Browse other questions tagged or ask your own question.