5
$\begingroup$

Is it possible to change the way Mathematica rotate its 3D output graphics, when the user uses the mouse ? Here's a MWE to work with :

ParametricPlot3D[{Cos[p], Sin[p], 0},
    {p, 0, 2 Pi},
    Boxed -> False,
    Axes -> True,
    Ticks -> True,
    AxesOrigin -> {0, 0, 0},
    ImageSize -> {700, 700},
    SphericalRegion -> True
]

By default, Mma rotates the view around a vertical axis when the user move the mouse from left to right and back. I would like to make it rotate the view around the main axis ("z") in this example, instead.

If the user move the mouse vertically, then the view should rotate as usual (around the horizontal axis), or maybe around one of the axis of the plot ? ("X" or "Y", I don't know yet what would be best in this case).


EDIT : When you use Show to plot several objects (surfaces, vectors, etc), Mathematica rotates the view around the "center of mass" of the whole. In some cases, you may want to rotate your view around a particular point in space (the center of the main object, say). So what command could achieve this ?

I tried ViewCenter -> {{0, 0, 1}, {0.5, 0.5}}, and also ViewPoint -> {0, 0, 1}, to rotate the view around the point {0, 0, 1} (for example), but it doesn't behave correctly. When I move my mouse, I'm getting some weird motion with much exagerated view angles.

So what to do in this case ?

$\endgroup$
1

1 Answer 1

9
$\begingroup$

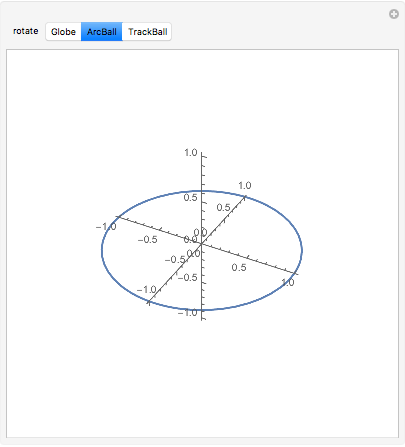
See "Method" in Graphics3D.

Manipulate[
 ParametricPlot3D[{Cos[p], Sin[p], 0}, {p, 0, 2 Pi}, Boxed -> False, 
  Axes -> True, Ticks -> True, AxesOrigin -> {0, 0, 0}, 
  SphericalRegion -> True, 
  Method -> {"RotationControl" -> Dynamic@rotate}],
 {rotate, {"Globe", "ArcBall", "TrackBall"}}
 ]

Mathematica graphics

To change the setting in an existing graphic, use Show:

g = ParametricPlot3D[{Cos[p], Sin[p], 0}, {p, 0, 2 Pi}, 
  Boxed -> False, Axes -> True, Ticks -> True, 
  AxesOrigin -> {0, 0, 0}, SphericalRegion -> True]

Show[g, Method -> {"RotationControl" -> "Globe"}]
$\endgroup$
7
  • 1
    $\begingroup$ The command Method -> {"RotationControl" -> "Globe"} appears to be doing exactly what I needed. Thanks a lot ! $\endgroup$
    – Cham
    Commented Mar 6, 2016 at 18:54
  • $\begingroup$ @Cham You're welcome! $\endgroup$
    – Michael E2
    Commented Mar 6, 2016 at 18:55
  • $\begingroup$ I'll wait a bit before marking your answer as "THE" answer, just in case someone post something else interesting. This "Globe" method make the manipulations MUCH more easy ! In my view, it should be the default setting ! $\endgroup$
    – Cham
    Commented Mar 6, 2016 at 18:59
  • 3
    $\begingroup$ It is the default for Plot3D: Plot3D[x y, {x, -1, 1}, {y, -1, 1}] // Options. I guess the idea is that in such a plot the third axis is naturally vertical, but in a parametric plot, there is not always a natural orientation. $\endgroup$
    – Michael E2
    Commented Mar 6, 2016 at 19:05
  • $\begingroup$ It make sense ! Thanks for the explanation. $\endgroup$
    – Cham
    Commented Mar 6, 2016 at 19:07

Your Answer

By clicking “Post Your Answer”, you agree to our terms of service and acknowledge you have read our privacy policy.

Not the answer you're looking for? Browse other questions tagged or ask your own question.