1
$\begingroup$

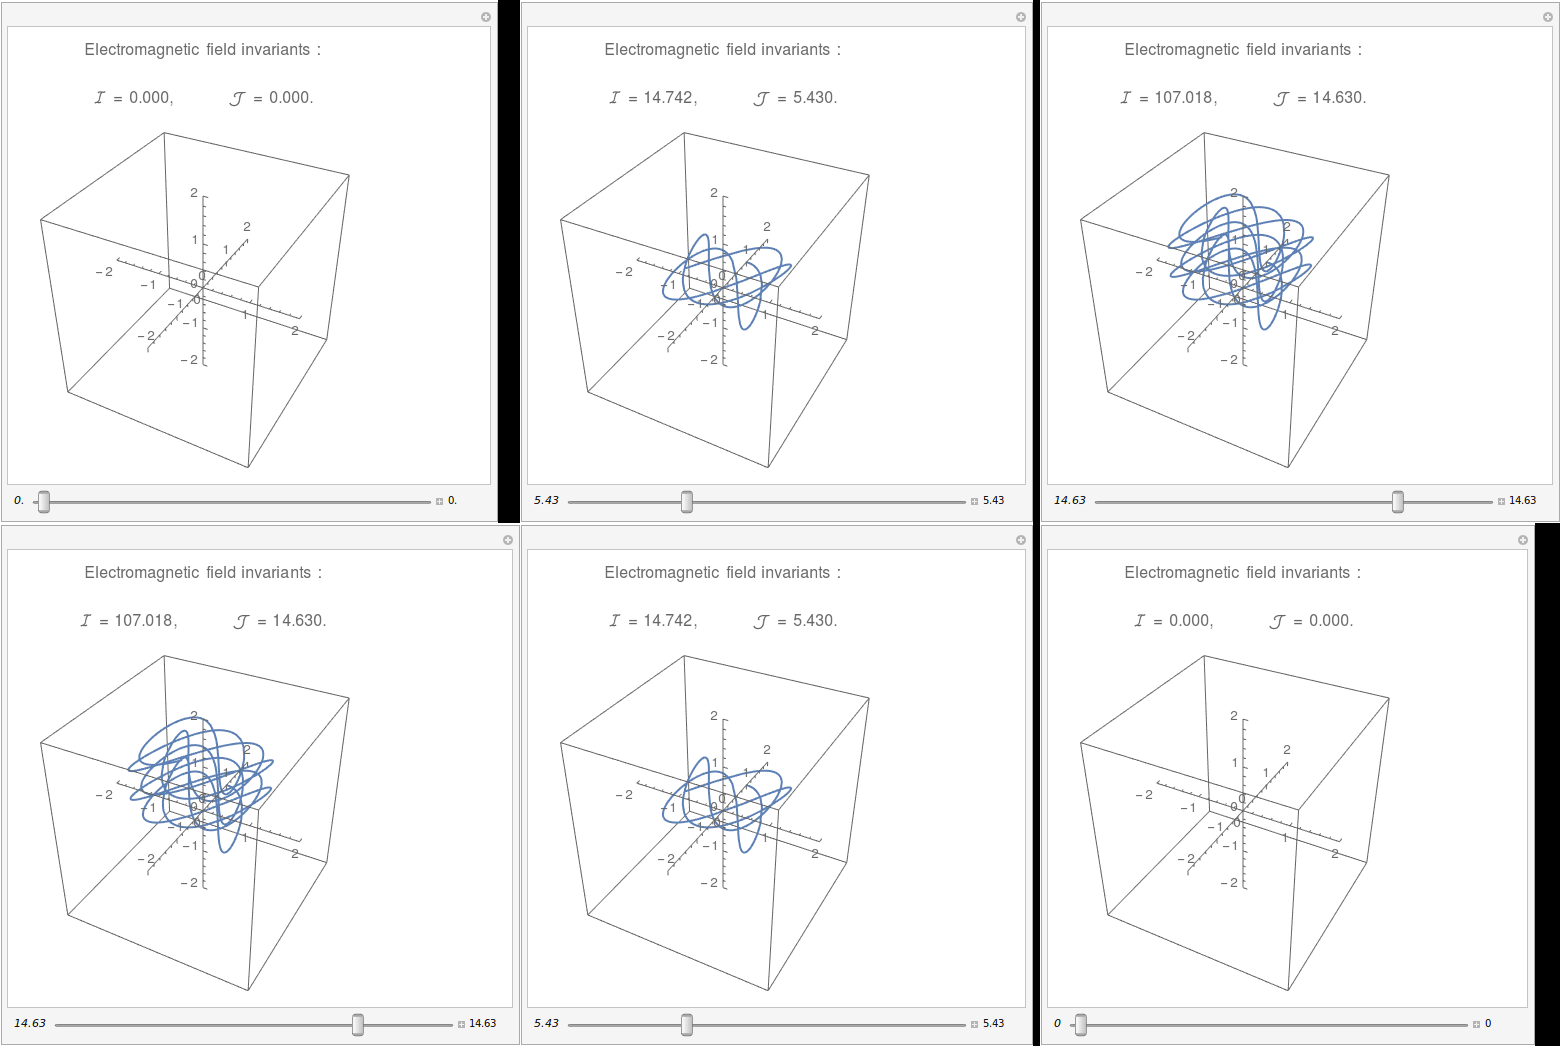
I need to add a string of text with some output data at the bottom-center of a manipulate output. The manipulate output itself is 3D. Here's a MWE to work with :

Manipulate[ParametricPlot3D[
    {Sin[3 s], Cos[5 s], 0.1 s},
    {s, 0.001, t},
    PlotRange -> {{-2, 2}, {-2, 2}, {-2, 2}},
    Axes -> True,
    AxesOrigin -> {0, 0, 0},
    SphericalRegion -> True
    ],
{{t, 0, Style[Row[{t}], Italic, 10]}, 0, 6 Pi, 0.01,
ImageSize -> Large,
Appearance -> {"Labeled", "Closed"}
},
ControlPlacement -> Bottom]

Currently, I defined the text with output as this :

Invariants[t_] := Text[
    Row[{
        "Electromagnetic field invariants :\n\n",
        "\[ScriptCapitalI] = ",
        NumberForm[t^2/2, {12, 3}],
        ",\t",
        "\[ScriptCapitalJ] = ",
        NumberForm[t, {12, 3}],
        "."
    }, BaseStyle -> {FontSize -> 12, 
    FontFamily -> "Helvetica"}], {5, -1.25}
]

I also guess that I need to add this command inside my manipulate code, but it doesn't work :

Epilog -> Invariants[t]

I believe the source of the problem is that the manipulate output is a 3D graphics, while the text I defined would only work on a 2D graphics.

So how should I superpose a few lines of text with data on a 3D graphics, in manipulate ?

Take note : I don't want the text with data to be in 3D. Just a few lines of horizontal text superposed on the 3D graphics.

$\endgroup$
4
  • $\begingroup$ What is the command that generates the 3D output? You will want to share the whole Manipulate code for more meaningful answers. $\endgroup$
    – MarcoB
    Commented Feb 19, 2016 at 15:49
  • $\begingroup$ Without the full code, I can't generate an answer for your problem, but if you look here there is an example of using Graphics3D[ Text[ _____, coords] ] to place text in 3D graphics at a given point. $\endgroup$
    – Jason B.
    Commented Feb 19, 2016 at 15:51
  • $\begingroup$ The manipulate code is complicated. I'll try to make a MWE. $\endgroup$
    – Cham
    Commented Feb 19, 2016 at 16:10
  • $\begingroup$ I've edited the question to add a very simple MWE. $\endgroup$
    – Cham
    Commented Feb 19, 2016 at 16:18

2 Answers 2

4
$\begingroup$
Invariants[t_] := 
 Text[Row[{"Electromagnetic field invariants :\n\n", 
    "\[ScriptCapitalI] = ", NumberForm[t^2/2, {12, 3}], ",\t", 
    "\[ScriptCapitalJ] = ", NumberForm[t, {12, 3}], "."}, 
   BaseStyle -> {FontSize -> 12, FontFamily -> "Helvetica"}], 
  Scaled[{0.5, 0.92}]]
Manipulate[
 ParametricPlot3D[{Sin[3 s], Cos[5 s], 0.1 s}, {s, 0.001, t}, 
  PlotRange -> {{-2, 2}, {-2, 2}, {-2, 2}}, Axes -> True, 
  AxesOrigin -> {0, 0, 0}, SphericalRegion -> True, 
  Epilog -> Invariants[t]], {{t, 0, Style[Row[{t}], Italic, 10]}, 0, 
  6 Pi, 0.01, ImageSize -> Large, 
  Appearance -> {"Labeled", "Closed"}}, ControlPlacement -> Bottom]

Mathematica graphics

$\endgroup$
2
  • $\begingroup$ It works ! Now, how do you center the text horizontaly, and make it at bottom of the graphics ? $\endgroup$
    – Cham
    Commented Feb 19, 2016 at 16:40
  • $\begingroup$ Ok, the text position appears to be trivial ! $\endgroup$
    – Cham
    Commented Feb 19, 2016 at 16:49
5
$\begingroup$

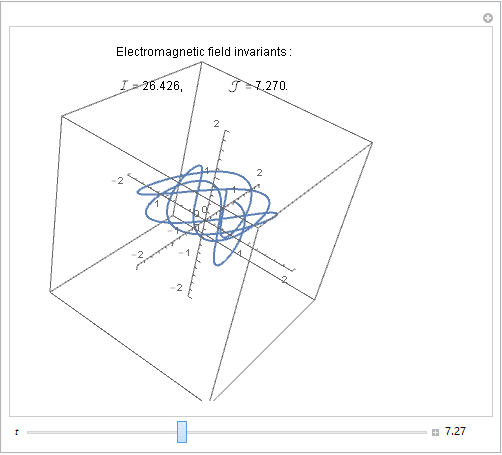
So I would use your text as the PlotLabel, I would remove the Text wrapper, and give the Style option to the plotting function instead,

Invariants[t_] := 
      Row[{
            "Electromagnetic field invariants :\n\n",
            "\[ScriptCapitalI] = ",
            NumberForm[t^2/2, {12, 3}],
            ",\t",
            "\[ScriptCapitalJ] = ",
            NumberForm[t, {12, 3}],
            "."}];

Manipulate[
 ParametricPlot3D[
      {Sin[3 s], Cos[5 s], 0.1 s},
      {s, 0.001, t},
      PlotRange -> {{-2, 2}, {-2, 2}, {-2, 2}},
      Axes -> True,
      AxesOrigin -> {0, 0, 0},
      SphericalRegion -> True, PlotLabel -> Invariants[t],
  BaseStyle -> {FontSize -> 12, FontFamily -> "Helvetica"}],
 {{t, 0, Style[Row[{t}], Italic, 10]}, 0, 6 Pi, 0.01,
  ImageSize -> Large,
  Appearance -> {"Labeled", "Closed"}
  },
 ControlPlacement -> Bottom]

enter image description here

$\endgroup$
2
  • $\begingroup$ Can you superpose the text on the 3D graphics, at bottom ? $\endgroup$
    – Cham
    Commented Feb 19, 2016 at 16:47
  • $\begingroup$ @Cham I just left the office for the day, but have a look at this mathematica.stackexchange.com/q/87283/9490 $\endgroup$
    – Jason B.
    Commented Feb 19, 2016 at 16:49

Your Answer

By clicking “Post Your Answer”, you agree to our terms of service and acknowledge you have read our privacy policy.

Not the answer you're looking for? Browse other questions tagged or ask your own question.