9
$\begingroup$

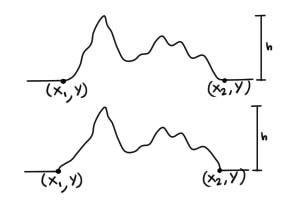
I am going crazy trying to create this. I am trying to create a pulsar graph that starts and ends on two points that have the same y smoothly along the x axis. The pulsar should have random valleys and peaks. The height of the graph should also be variable.

Here the first graph is what I want, while the second one is the best that I think I can produce.
Example

I have tried lots of different things from generating some random points and trying to interpolate them(the result is not smooth along the x axis) to adding random functions using Exp[](but failing on making it fall between two points).

This is to create something similar to
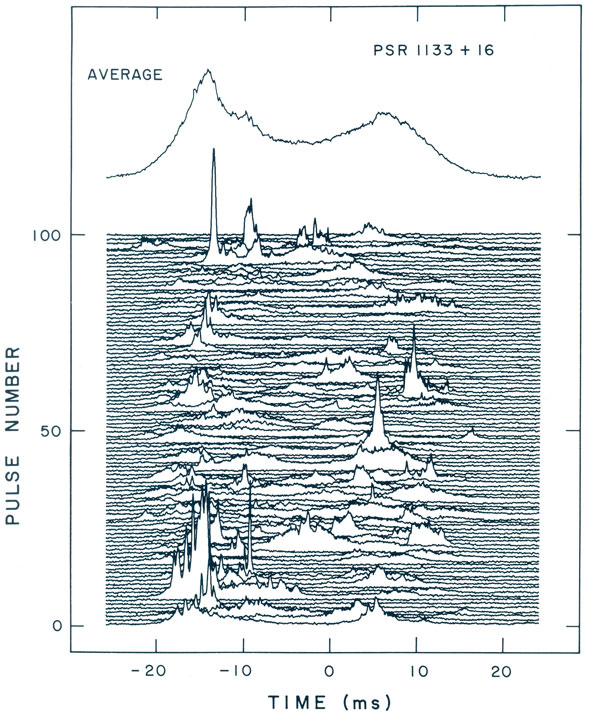
enter image description here
(source)

or

this

but still have more freedom on where to put the waves. I hope I managed to explain myself correctly.

P.D. I managed to find this similar answer in the past, but I cant make the graph between two random points and hence creating this question.

Edit: After lots of trial an error I found a way to do this.

I created 3 functions.

Jaggify[list_, height_] := 
 Union[Flatten[
   Table[{list[[x]], {(list[[x, 1]] + list[[x + 1, 1]])/
      2., (list[[x, 2]] + list[[x + 1, 2]])/2. + 
       height RandomReal[]^5}, list[[x + 1]]}, {x, 1, 
     Length[list] - 1}], 1]]

This function receives a list of points. Then it iterates over pair of points and adds a new one in between. The height of the new point is in the middle of the two adjacent points plus a random value.

RandomPulsarPoints[start_, end_, y_, peaks_, height_] := 
 Module[{list, seedlist},
  list = Table[{start + x, y}, {x, 0, end - start, (end - start)/
     peaks}];
  seedlist = Table[
    {list[[linum, 1]], 
     list[[linum, 2]] + 
      If[linum == 1 || linum == 2 || linum == Length[list] - 1 || 
        linum == Length[list]
       , 0
       , RandomChoice[{1/linum^3, 
          1 - 1/linum^3} -> {height^3 RandomReal[], 
          height (RandomReal[])^3}]]}, {linum, 1, Length[list]}];
  Join[{First[seedlist]}, 
   Jaggify[Jaggify[Most[Rest[seedlist]], height], 
    height/2], {Last[seedlist]}]
  ]

This function generates a list of random points between start and end. The first two points and the last two have the same y value to force the graph to start and end smoothly. You can define how tall and how many peaks are there going to be in that interval.

pulsar[start_, end_, y_, height_, peaks_] := 
 Module[{length = end - start},
  If[length == 0 || peaks == 0, BSplineCurve[{{start, y}, {end, y}}], 
   BSplineCurve[RandomPulsarPoints[start, end, y, peaks, height]]]]

This final function just uses the previous functions to create a BSplineCurve.

Graphics[pulsar[0, 10, 0, 3, 10]]
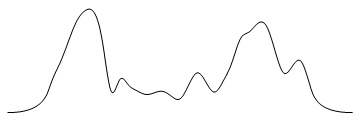
This is the result.

I hope this is useful to someone else. :)

I think this question can be closed now.

$\endgroup$
6
  • 1
    $\begingroup$ This and this. $\endgroup$
    – march
    Commented Dec 17, 2015 at 19:48
  • $\begingroup$ Plotting the graphs one on top of each other is not the issue. I can do that just fine. The second link I already found it before but I am unable to make it so that I can give two points and make the pulsar graph start and end between the two points. $\endgroup$
    – listix
    Commented Dec 17, 2015 at 19:53
  • $\begingroup$ I believe it's almost a dup of this. Won't vote to close, my vote is bonding $\endgroup$ Commented Dec 17, 2015 at 20:11
  • 1
    $\begingroup$ Also take a look at BrownianBridgeProcess[ ] $\endgroup$ Commented Dec 17, 2015 at 20:16
  • $\begingroup$ BrownianBridgeProcess looks promising. While looking at the manual I also found SmoothHistogram which looked even better. I would love something like that but for two points. I didn't know doing this would involve so much work. $\endgroup$
    – listix
    Commented Dec 17, 2015 at 20:38

3 Answers 3

7
$\begingroup$

After lots of trial an error I found a way to do this.

I created 3 functions.

Jaggify[list_, height_] := 
 Union[Flatten[
   Table[{list[[x]], {(list[[x, 1]] + list[[x + 1, 1]])/
      2., (list[[x, 2]] + list[[x + 1, 2]])/2. + 
       height RandomReal[]^5}, list[[x + 1]]}, {x, 1, 
     Length[list] - 1}], 1]]

This function receives a list of points. Then it iterates over pair of points and adds a new one in between. The height of the new point is in the middle of the two adjacent points plus a random value.

RandomPulsarPoints[start_, end_, y_, peaks_, height_] := 
 Module[{list, seedlist},
  list = Table[{start + x, y}, {x, 0, end - start, (end - start)/
     peaks}];
  seedlist = Table[
    {list[[linum, 1]], 
     list[[linum, 2]] + 
      If[linum == 1 || linum == 2 || linum == Length[list] - 1 || 
        linum == Length[list]
       , 0
       , RandomChoice[{1/linum^3, 
          1 - 1/linum^3}-> {(height^3) RandomReal[], 
          height (RandomReal[])^3}]]}, {linum, 1, Length[list]}];
  Join[{First[seedlist]}, 
   Jaggify[Jaggify[Most[Rest[seedlist]], height], 
    height/2], {Last[seedlist]}]
  ]

This function generates a list of random points between start and end. The first two points and the last two have the same y value to force the graph to start and end smoothly. You can define how tall and how many peaks are there going to be in that interval.

    pulsar[start_, end_, y_, height_, peaks_] := 
     Module[{length = end - start},
      If[length == 0 || peaks == 0, BSplineCurve[{{start, y}, {end, y}}], 
       BSplineCurve[RandomPulsarPoints[start, end, y, peaks, height]]]]

This final function just uses the previous functions to create a BSplineCurve.

Graphics[pulsar[0, 10, 0, 3, 10]]

This is the result.

I hope this is useful to someone else. :)

$\endgroup$
3
$\begingroup$

One way to smooth things is to use an appropriate interpolating order with random points. The ends can be flattened out with the Hamming Window.

points = HammingWindow[Range[-0.7, 0.7, 0.1]] RandomReal[{0, 1}, 15];
Plot[Interpolation[points, InterpolationOrder -> 3][t], {t, 1, Length[points]}]

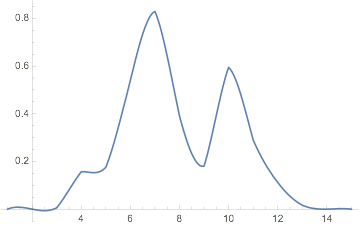
enter image description here

$\endgroup$
3
  • $\begingroup$ I havent seen that function, but the problem I see with this solution is being able to draw this starting on any random point and extend towards another random point. Besides the ends dont seem as smooth as I would like. $\endgroup$
    – listix
    Commented Dec 19, 2015 at 3:18
  • $\begingroup$ Flatten the ends more by extending the Range... maybe -0.8 to 0.8 or further. If you want to start it and end it at different values, just add a constant (or a line if the two endpoints are different). $\endgroup$
    – bill s
    Commented Dec 19, 2015 at 4:13
  • $\begingroup$ I see what you mean the problem is that if I keep adding more and more points the general figure of the function doesn't change. I think it will be useful to something else I am trying to do. $\endgroup$
    – listix
    Commented Dec 19, 2015 at 16:48
1
$\begingroup$

I decided that instead of trying to use Interpolation, I would interpolate between the points using the solutions of a 4th-order ODE with appropriate boundary conditions, and then stitch them together using Piecewise. I think the results are rather appealing. I also have a random number of "peaks" which I create by using Sin.

wavePoints[n_, k_] :=
  Chop@Sin[Pi*Range[0, k, k/(n - 1)]]^4*RandomReal[{1/3, 3}, {n}];

pulsarWave[n_] :=
 Module[{
   pairs = Partition[wavePoints[n + 1, RandomInteger[{1, 4}]], 2, 1],
   x, t, sols, pw
  },
  sols = NDSolveValue[{x''''[t] == -x[t], x[0] == #[[1]], x'[0] == 0, 
       x[1] == #[[2]], x'[1] == 0},  x, {t, 0, 1}] & /@ pairs;

  Activate[Inactive[Function][t,
       Piecewise@Table[
        {sols[[i + 1]][t - i], i <= t < i + 1}, {i, 0, n - 1}]]]];

Here's a sample of the output:

GraphicsColumn[
 Table[With[{wave = pulsarWave[10]},
   Plot[wave[t], {t, -1, 11}, Axes -> False]],
  {5}]]

Unknown Pleasures

$\endgroup$

Your Answer

By clicking “Post Your Answer”, you agree to our terms of service and acknowledge you have read our privacy policy.

Not the answer you're looking for? Browse other questions tagged or ask your own question.