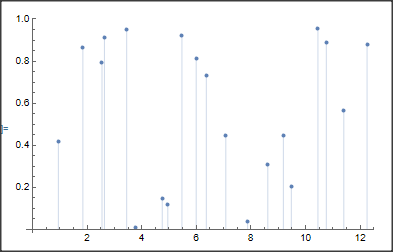
How to plot a random impulse train with random height and space? From the following code, I was able to get a random height graph and a random interval space graph.
randHeights = Mod[{RandomVariate[NormalDistribution[5, 2], 20]}, 1];
randSpace = RandomVariate[NormalDistribution[5, 2]];
f[t_] := 1;

GraphicsRow[{
  ListPlot[randHeights, Filling -> Axis, PlotStyle -> Red,
   PlotRange -> All, AspectRatio -> .5],

  ListPlot[Table[{t, f[t]}, {t, 0, 50, randSpace}], Filling -> Axis,
   AspectRatio -> .5]
  }]
You may get a different result from the one I have here, and I'm still unsure how to combine these two concepts.
 I'm looking for a single graph that has different intervals & heights (with a maximum of 1) on every run. Any idea, anyone? Thanks for the help!


randSpace = Table[RandomVariate[NormalDistribution[5, 2]], 1000];andSort[randSpace][[1 ;; 10]]can easily generate negative numbers. Usually random delay is specified around a base delay and is a fraction of a base delay. $\endgroup$Sortcommand? $\endgroup$UniformDistributionwere chosen. $\endgroup$