3
$\begingroup$

I am plotting a curl, and I only want VectorPlot3D to show one arrow, I have tried adjusting VectorPoints-> 1, but the plot show's no arrows at all. Is 2 the minimum VectorPoints I can have?

If I cannot make use of VectorPlot3d in this way, how can I use the Arrow function to point in the direction of a vector field at a certain point?

Thank-you

$\endgroup$
3
  • $\begingroup$ I don't understand what you mean by "show one arrow". Where should this "one arrow" be in your plot? $\endgroup$ Commented Aug 1, 2012 at 14:36
  • 1
    $\begingroup$ Welcome to Mathematica SE! If you post a working code snippet, you'll surely get faster & better answers. Also be sure to format the code by indenting it by four spaces or using ``. $\endgroup$
    – Ajasja
    Commented Aug 1, 2012 at 14:36
  • $\begingroup$ Please also consider to register your account. This will make it possible to place comments below questions and answers and will keep account of your questions and answers and your reputation gained by them. $\endgroup$ Commented Aug 1, 2012 at 15:00

3 Answers 3

2
$\begingroup$

I don't think it's possible. I assume the vector scaling routine needs at least two vectors. You can fake it though:

VectorPlot3D[{x, y, z}, {x, -1, 1}, {y, -1, 1}, {z, -1, 1}, 
 VectorPoints -> {0.9999999 {0.5, 0.5, 0.5}, {0.5, 0.5, 0.5}}]

Mathematica graphics

$\endgroup$
0
2
$\begingroup$

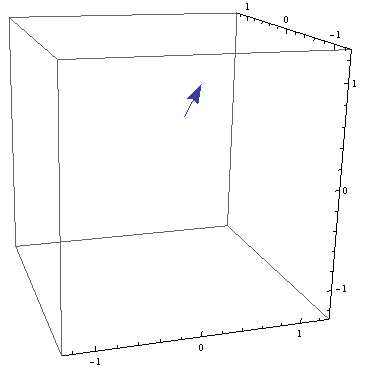
The error message that

VectorPlot3D[{x, y, z}, {x, -1, 1}, {y, -1, 1}, {z, -1, 1}, VectorPoints -> {1, 1, 1}]

produces

enter image description here

suggests that two is indeed the minimum number of VectorPoints.

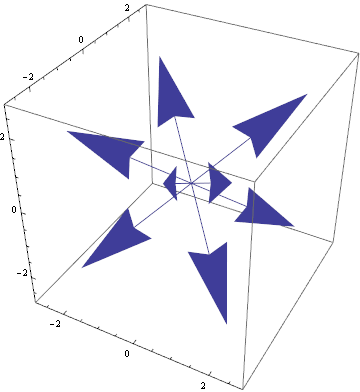
EDIT: Using

 vp1=VectorPlot3D[{x, y, z}, {x, -1, 1}, {y, -1, 1}, {z, -1, 1}, VectorPoints -> {2, 2, 2}]

enter image description here

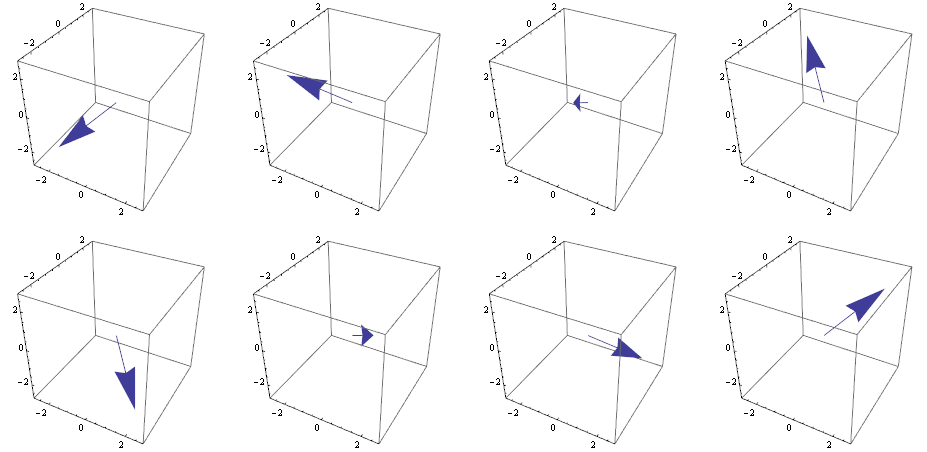
a workaround is possible by manipulating the components of the Graphics3D object vp1:

GraphicsGrid[
Partition[
(vp2 = vp1; vp2[[1, 2, 1, 2]] = vp2[[1, 2, 1, 2, #]];vp2) & /@ Range[8],
4]]

enter image description here

$\endgroup$
2
$\begingroup$

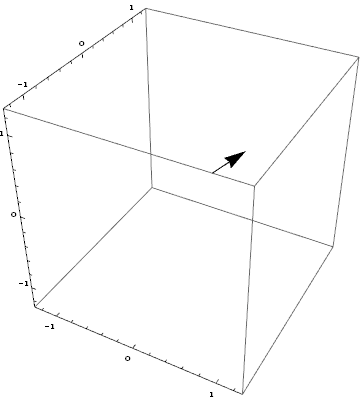
You can specify two vectors, one of which is the vector you want, then use VectorColorFunction to hide the undesired one.

VectorPlot3D[{x, y, z}, {x, -1, 1}, {y, -1, 1}, {z, -1, 1},
 VectorPoints -> {{.5, 0, .3}, {.4, .1, .4}},
 VectorColorFunctionScaling -> False,
 VectorColorFunction -> Function[{x, y, z, vx, vy, vz, n},
   If[{x, y, z} == {.4, .1, .4}, Black, Directive[Opacity[0]]]
   ]
 ]

Mathematica graphics

$\endgroup$
2
  • $\begingroup$ thanks for the nice example with colorfunction, I haven't come across something like this in the wolfram reference page $\endgroup$
    – Mel
    Commented Aug 2, 2012 at 16:32
  • $\begingroup$ @Mel you are welcome :) $\endgroup$
    – Silvia
    Commented Aug 2, 2012 at 19:20

Your Answer

By clicking “Post Your Answer”, you agree to our terms of service and acknowledge you have read our privacy policy.

Not the answer you're looking for? Browse other questions tagged or ask your own question.