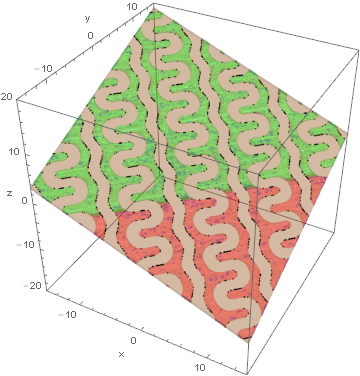
6
$\begingroup$

This question uses Mathematica 10.2.0.0.

equation1 is the major unbounded region I would like to generate:

s = 0.36109;
t = 1*(1 - s);
equation1 = 1.505 < (1 - s)*8*(Sin[2*x]*Sin[z]*Cos[y] + Sin[2*y]*Sin[x]*Cos[z] +
    Sin[2*z]*Sin[y]*Cos[x]) - s*4*(Cos[2*x]*Cos[2*y] + Cos[2*y]*Cos[2*z] + 
    Cos[2*z]*Cos[2*x]) - t;

Now I generate an implicit region, I am bounding this by {x,y,z} as well as by two {1,-1,2} planes

region1 = ImplicitRegion[equation1 && 6 <= x - y + 2*z <= 7,
     {{x, -5*Pi, 5*Pi}, {y, -5*Pi, 5*Pi}, {z, -10, 10}}];

region1 will be used to define a region to randomly assign {x,y,z} points

pts1 = RandomPoint[region1, 10^4];

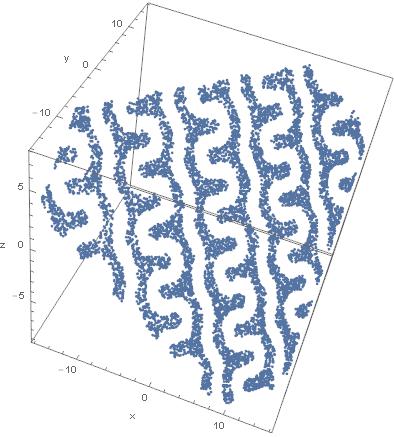
ListPointPlot3D[pts1, Axes -> True, AxesLabel -> {"x", "y", "z"}, BoxRatios -> {1, 1, 1}]

You can see from the plot that the z bounds are arbitrarily chosen, more problematic, the x- and y-bounds will change with z, e.g. if z is unbounded the x-bounds will be from ~-5 to 5Pi enter image description here Any help is appreciated.

$\endgroup$
1
  • $\begingroup$ In the meantime, while RandomPoint[] is being fixed, have you seen this? $\endgroup$ Commented Aug 2, 2015 at 3:03

3 Answers 3

6
$\begingroup$

There appears to be a bug in RandomPoint, as can be seen by plotting both region1 and region2, the latter defined by

region2 = ImplicitRegion[6 <= x - y + 2*z <= 7, 
    {{x, -5*Pi, 5*Pi}, {y, -5*Pi, 5*Pi}, {z, -10, 10}}];

Then

pts2 = RandomPoint[region2, 10^4];
ListPointPlot3D[{pts2, pts1}, AxesLabel -> {"x", "y", "z"}, BoxRatios -> {1, 1, 1}, 
    PlotRange -> {{x, -5*Pi, 5*Pi}, {y, -5*Pi, 5*Pi}, {z, -10, 10}}, 
    PlotStyle -> {Brown, Blue}]
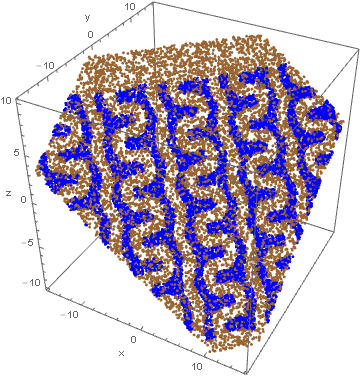
enter image description here

It is natural to ask whether region1 actually stops where shown here. It does not. For instance,

NMaximize[z, {x, y, z} ∈ region1]
(* {10., {x -> -10.7241, y -> 2.59226, z -> 10.}} *)

That the fault lies with RandomPoint also can be seen from

Max[Cases[pts1, {_, _, z_} -> z]]
(* 7.67556 *)

Workaround

One way to recover the missing upper portion of the region1 plot is

region3 = ImplicitRegion[equation1 && 6 <= x - y + 2*z <= 7, 
    {{x, -5*Pi, 5*Pi}, {y, -5*Pi, 5*Pi}, {z, 7, 10}}];
pts3 = RandomPoint[region3, 1.5 10^3];
ListPointPlot3D[{pts2, pts1, pts3}, AxesLabel -> {"x", "y", "z"}, BoxRatios -> {1, 1, 1}, 
    PlotRange -> {{x, -5*Pi, 5*Pi}, {y, -5*Pi, 5*Pi}, {z, -10, 10}}, 
    PlotStyle -> {Brown, Blue, Red}]
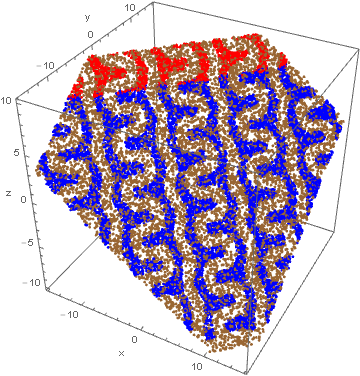
enter image description here

A similar workaround could be used to recover the small portion of region1 missing at the bottom of the plot.

It is natural to ask why the lower bound in z in region3 is not set at 7.67556, so that there is no overlap between region1 and region3. It turns out that RandomPoint generates no points below about z = 8 in that case. To eliminate the overlapping region of points, one could use DeleteCases.

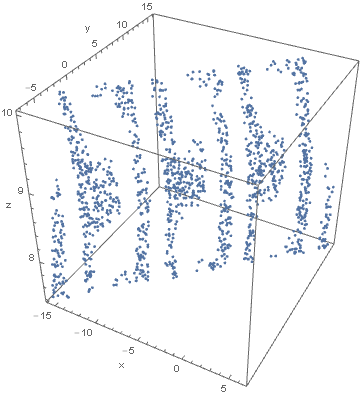
ListPointPlot3D also seems to behave strangely, effectively ignoring PlotRange. So, for instance,

plt3 = ListPointPlot3D[pts3, AxesLabel -> {"x", "y", "z"}, BoxRatios -> {1, 1, 1}, 
     PlotRange -> {{x, -5*Pi, 5*Pi}, {y, -5*Pi, 5*Pi}, {z, -10, 10}}]
enter image description here

Options[plt3, PlotRange]
(* {PlotRange -> {{-15.7075, 6.41088}, {-7.15594, 15.7007}, Automatic}} *)

I leave it to others to decide whether this is a bug in ListPointPlot3D. Certainly the treatment of PlotRange differs from that in ListPlot.

For the record,

$Version
(* "10.2.0 for Microsoft Windows (64-bit) (July 7, 2015)" *)
$\endgroup$
1
$\begingroup$

Seems like this is an issue, thanks for looking into this @bbgodfrey. I went ahead and created four regions and got rid of the upper/lower z-bounds by increasing to -20<=z<=20. region1 is what I want, region2 through region4 are for testing.

region1 is the original region that I want bounded by equation1, x, y, and two planes 6<=x-y+2*z<=7 (blue)

region2 is the solid region bounded by x, y, and two planes 6<=x-y+2*z<=7 (brown)

region3 is just region1 with z<=0 (green).

region4 is just region1 with z>=0 (red).

(*Define equation1*) s = 0.36109; t = 1*(1 - s);
equation1 = 1.505 < (1 - s)*8*(Sin[2*x]*Sin[z]*Cos[y] + Sin[2*y]*Sin[x]*Cos[z] + Sin[2*z]*Sin[y]*Cos[x]) - s*4*(Cos[2*x]*Cos[2*y] + Cos[2*y]*Cos[2*z] + Cos[2*z]*Cos[2*x]) - t;

(*Define the regions*)
region1 = ImplicitRegion[equation1 && 6 < x - y + 2*z < 7, {{x, -5*Pi, 5*Pi}, {y, -5*Pi, 5*Pi}, {z, -20, 20}}];
region2 = ImplicitRegion[6 < x - y + 2*z < 7, {{x, -5*Pi, 5*Pi}, {y, -5*Pi, 5*Pi}, {z, -20, 20}}];
region3 = ImplicitRegion[equation1 && 6 < x - y + 2*z < 7, {{x, -5*Pi, 5*Pi}, {y, -5*Pi, 5*Pi}, {z, -20, 0}}];
region4 = ImplicitRegion[equation1 && 6 < x - y + 2*z < 7, {{x, -5*Pi, 5*Pi}, {y, -5*Pi, 5*Pi}, {z, 0, 20}}];

(*Now I make random points inside of these regions, the total number of points "pt" is left as a variable so we can change it later*)
pts1[pt_] := RandomPoint[region1, pt];
pts2[pt_] := RandomPoint[region2, pt];
pts3[pt_] := RandomPoint[region3, pt/2];
pts4[pt_] := RandomPoint[region4, pt/2];

Now to check how RandomPoint distributed the points I check first the regions:

RegionPlot3D[{region1, region2, region3, region4}, Axes -> True, AxesLabel -> {"x", "y", "z"}, BoxRatios -> {1, 1, 1}, PlotPoints -> 500, PlotRange -> {{-5*Pi, 5*Pi}, {-5*Pi, 5*Pi}, {-20, 20}}, PlotStyle -> {{Opacity[0.25], Blue}, {Opacity[0.25], Brown}, {Opacity[0.25], Red}, {Opacity[0.25], Green}}]

enter image description here

Everything looks ok as far as how the regions are defined.

Now let's check how the points generated by RandomPoint are distributed:

Table[ListPointPlot3D[{pts1[pt], pts2[pt], pts3[pt], pts4[pt]}, Axes -> True, PlotRange -> All, AxesLabel -> {"x", "y", "z"}, BoxRatios -> {1, 1, 1}, PlotRange -> {{-5*Pi, 5*Pi}, {-5*Pi, 5*Pi}, {-10, 10}}, ImageSize -> 300, PlotStyle -> {{Opacity[1], Blue}, {Opacity[1], Brown}, {Opacity[1], Red}, {Opacity[1], Green}}], {pt, {10, 10^2, 10^3, 10^4, 10^5}}]

enter image description here

It seems that there is indeed a bug with the way RandomPoint calculates the region in which to distribute points, like @bbgodfrey suggests. As you can see, region1 (blue) is decent but does not generate points near the minimum z. region2 (brown) generates points in the entire region as defined. region3 (red) and region4 (green) are most problematic.

For now Randompoint[region1, 10^4] is good enough. I have contacted Mathematica tech support and will update if their comments are helpful.

$\endgroup$
1
$\begingroup$

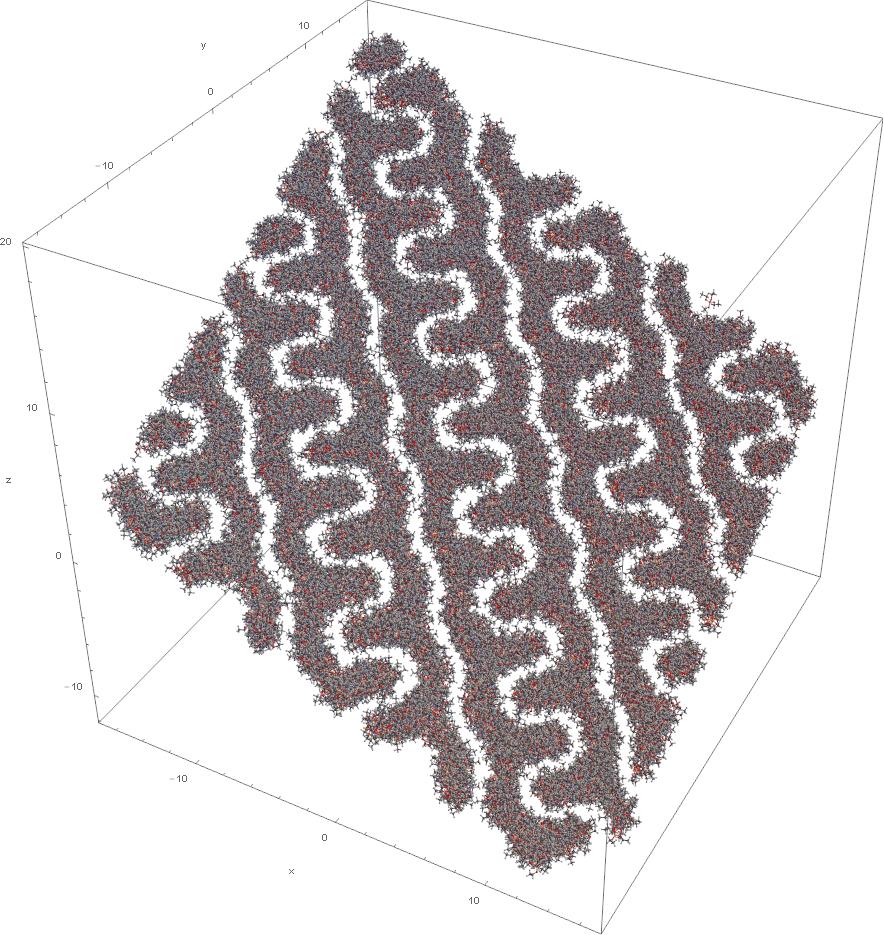
FYI, the random points being generated will serve as coordinate centers for randomly oriented molecules.

We can generate the molecules onto the random points in region1. We want each molecule to have a random orientation so we need to do rotational transformations before we translate the molecule to its new point

teosPEO := Table[
   GeometricTransformation[
    GeometricTransformation[
     GeometricTransformation[
      GeometricTransformation[
       GeometricTransformation[
        First@ChemicalData["TetraethylOrthosilicate", "MoleculePlot"],
        ScalingMatrix[{2*10^-3, 2*10^-3, 2*10^-3}]
        ],(*The first transform is to scale the molecule*)
       RotationTransform[RandomReal[2*Pi], {1, 0, 0}]
       ],(*The second transform is to rotate the molecule by a random angle about the x-axis*)
      RotationTransform[RandomReal[2*Pi], {0, 1, 0}]
      ],(*The third transform is to rotate the molecule by a random angle about the y-axis*)
     RotationTransform[RandomReal[2*Pi], {0, 0, 1}]
     ],(*The fourth transform is to rotate the molecule by a random angle about the z-axis*)
    TranslationTransform[{pts1[[i, 1]], pts1[[i, 2]], pts1[[i, 3]]}]
    ],(*The fifth transform is to translate the molecule by a random {x,y,z} vector that we defined by the RandomPoint function above*)
   {i, pt}];

enter image description here

You can see that there is a missing portion near the minimum in z. Pretty decent though.

$\endgroup$

Your Answer

By clicking “Post Your Answer”, you agree to our terms of service and acknowledge you have read our privacy policy.

Not the answer you're looking for? Browse other questions tagged or ask your own question.