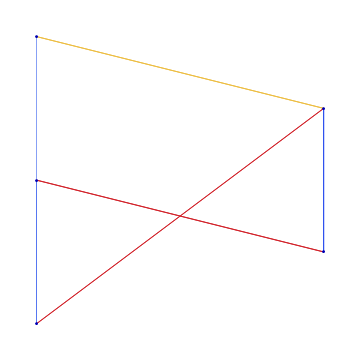
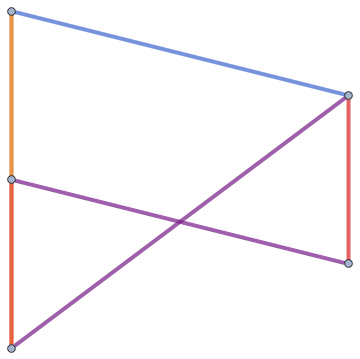
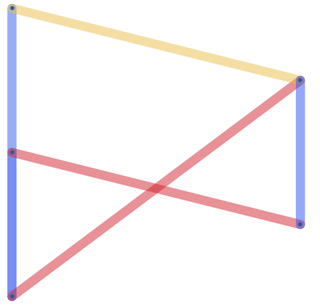
Following up on a previous question about how to color the nodes (vertices) of a network (graph) according to a color scaling of a property of those nodes, I'm now asking basically the same thing about edges:
How can I color the edges of a graph (using a gradient color scheme) according to the weight (or other property) of the edges using
GraphPlot?
It's easy if one just wants some conditional coloring (using "If[]"), but I (and I guess many people) want color scaling. Although there are some examples here that don't use GraphPlot, they won't work for me.
I did find one post that included something like an answer, but it was so complicated that I couldn't port it over to my case. So I'm trying to use the EdgeRenderingFunction and I can't get it to work.
To make this concrete, Here is a graph and a plot of a graph with edge weights between -1 and 1:
SomeGraph = WeightedAdjacencyGraph[{{∞, 1, .8, ∞, -1}, {1, ∞, .6, -1, ∞},
            {1, .6, ∞, ∞, -.6}, {∞, -0.5, ∞, ∞, 1}, {-1, ∞, -1, 1, ∞}},
            DirectedEdges -> False];
TheCoordinates = {{0, 1},{0, 2}, {0, 3}, {2, 1.5}, {2,2.5}};
PlotOfSomeGraph=GraphPlot[SomeGraph,
                          VertexCoordinateRules-> TheCoordinates,
                          VertexRenderingFunction ->
                    (Inset[Graphics[{Gray, Disk[{0, 0}, .01]}, ImageSize -> 17], #] &)]
And now I'd like to add an EdgeRenderingFunction to that GraphPlot so that they are colored on a rescaled reversed temperature map. I know that some adaptation of
EdgeRenderingFunction ->
  ({Opacity[0.5],ColorData[{"TemperatureMap", "Reverse"}][Rescale[...]], Line[#1]} &)
And to fill in the gap I can access some edge information using #1 for the endpoint coordinates, #2 for the start and ending vertices, and #3 for the edge label.
I might be able to kludge something using EdgeLabels, but because coloring edges by weight (or other property) is a basic feature of all other network tools I expect (or at least I expected) a simple way to do this in Mathematica (version 10.1).


