0
$\begingroup$

Bug fixed in V 10.2


In DynamicModule, the result is to show a panel with a flowchart and a Piechart. But when I export the dynamic result in a CSV file, the Piechart will no longer work. But the flowchart is still working.

To be more precise for discription of the question, I would like to mean that the Piechart works well, enter image description here
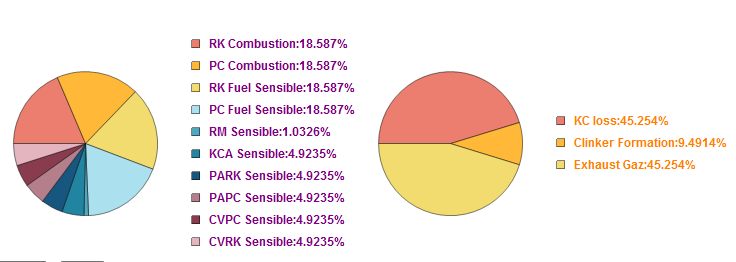
but when I clicked the Export, the Piechart will look like this.

enter image description here

Here, I have simplified the code uploaded to faciliate the comprehension of the code. Thanks.

DynamicModule[{FlowratePAPC = 100, TemperaturePAPC = 350, 
heatPAPCsensible, heatbalance},
heatbalance = {Button["Primary Air", 
 CreateDialog[
  Column[{Row[{Style["Flow rate(kg/hr)", Bold, 14], 
      InputField[Dynamic[FlowratePAPC], 
       ContinuousAction -> True]}], 
    Row[{Style["Flow temperature(\[Degree]C)", Bold, 14], 
      InputField[Dynamic[TemperaturePAPC], 
       ContinuousAction -> True]}]}]]] -> 
Style["Precalcinator", Bold, 14]};
Panel[Column[{LayeredGraphPlot[heatbalance, VertexLabeling -> True], 
Dynamic@PieChart3D[{Legended[heatPAPCsensible[], 
    Style["PCPA Sensible", Bold, 12, Black]]}],
Button["Export", 
 Export[SystemDialogInput["FileSave", 
   "Cement project data.csv"], {heatPAPCsensible[]}], 
 Method -> "Queued"]}]],
 Initialization :> ({heatPAPCsensible[] := 
 ThermodynamicData["Air", 
   "Enthalpy", {"Temperature" -> 
     Quantity[TemperaturePAPC, "Kelvins"], 
    "Pressure" -> Quantity[101325, "Pascals"]}]*
  Quantity[FlowratePAPC, "kg"]/Quantity[1, "hour"]})]
$\endgroup$
11
  • $\begingroup$ I don't understand your problem. I tried running your code, and it seems to work as far as I can tell. Can you please clarify what your problem is exactly? $\endgroup$
    – MarcoB
    Commented Jul 17, 2015 at 23:15
  • $\begingroup$ @MarcoB The problem is that once I click the Export button, the 3D piechart will no longer display. I do not know the reason. $\endgroup$
    – Aha
    Commented Jul 19, 2015 at 19:49
  • $\begingroup$ Aha, unfortunately I am unable to reproduce the behavior you describe on Mathematica 10.1.0. The pie chart still works even after pressing the export button. The problem may be version or system dependent. $\endgroup$
    – MarcoB
    Commented Jul 19, 2015 at 23:07
  • 1
    $\begingroup$ @aha, please specify your Mathematica version and OS $\endgroup$ Commented Jul 20, 2015 at 9:48
  • $\begingroup$ @Sjoerd C. de Vries Platform:Windows7 Prefessionnel, Mathematica:10.0. Thanks. $\endgroup$
    – Aha
    Commented Jul 20, 2015 at 11:10

1 Answer 1

1
$\begingroup$

I have contacted the technical support of MMA. They said it is related to the version problem that I should update to 10.2.

– Aha Jul 27 at 9:02

$\endgroup$

Your Answer

By clicking “Post Your Answer”, you agree to our terms of service and acknowledge you have read our privacy policy.

Not the answer you're looking for? Browse other questions tagged or ask your own question.