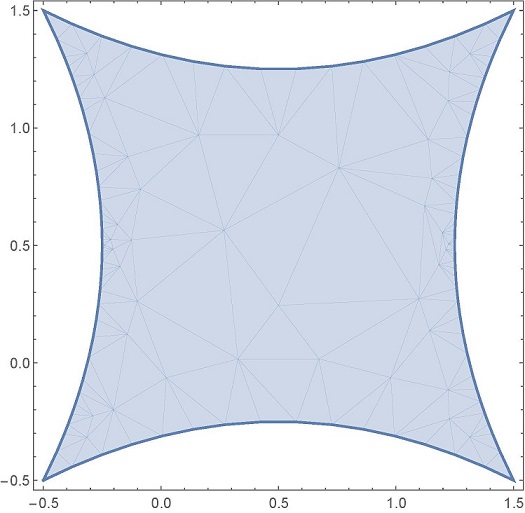
This code:
t = .25;
RegionPlot[TransformedRegion[Rectangle[{-1, -1}, {1, 1}], {Indexed[#1, {1}]
(1 + t ( Indexed[#1, {2}]^2 - 1)) + 2 t,Indexed[#1, {2}] (1 + t ( Indexed[#1,
{1}]^2 - 1)) + 2 t} &], PlotRange -> {{-0.5, 1.5}, {-0.5, 1.5}}]
gives me this:

Now, when I animate this transformation:
Animate[RegionPlot[TransformedRegion[Rectangle[{-1, -1}, {1, 1}],
{Indexed[#1, {1}] (1 + t ( Indexed[#1, {2}]^2 - 1)) + 2 t,
Indexed[#1, {2}] (1 + t ( Indexed[#1, {1}]^2 - 1)) + 2 t} &],
PlotRange -> {{-0.5, 1.5}, {-0.5, 1.5}}], {t, .25, .5}]
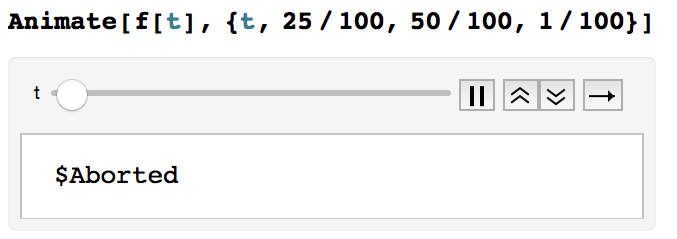
This is what I get:

I tried setting the "AnimationRunning" option for "Animate" to "False". When I do this, I get the transformation for the first value of "t", but the same thing happens when I try to get the figure by dynamically changing "t".
Any help is highly appreciated. Thanks in advance.


PlotRange->{{-0.5,1.5},{-0.5,1.5}}$\endgroup$PlotRange->AlltoPlotRange->{{-0.5. . .? I did that but it didn't work. Did it work for you? $\endgroup$Could you please tell me what you get?the screen shot I pasted in the comment shows what I get. Clicking on it shows the output. I just copied and pasted your input, and the Plot I get, as you can see, is not the same as what you have. Windows 7, 64 bit, V 10.1 $\endgroup$