1
$\begingroup$

I'm aware that there are a few threads on the topic of solving coupled ODEs using NDSolve and Manipulate. Based on those, I wrote the following code, solving my system of equations:

  Manipulate[{Solns = 
   NDSolve[{ee'[t] == -I*c1/2*(ge[t] - eg[t]) - c2*ee[t], 
     gg'[t] == I*c1/2*(ge[t] - eg[t]) + c2*ee[t], 
     ge'[t] == -c2/2*ge[t] + I*c1/2*(gg[t] - ee[t]) - c3/2*ge[t], 
     eg'[t] == -c2/2*eg[t] - I*c1/2*(gg[t] - ee[t]) - c3/2*eg[t], 
     ee[0] == 1, gg[0] == 0, ge[0] == 0, eg[0] == 0}, {ee, gg, ge, 
     eg}, {t, 0, 5}], 
  Plot[{ee[t] /. Solns, gg[t] /. Solns}, {t, 0, 5}]}, {{c1, 0, 
   "Rabi Frequency"}, 0, 10, 
  Appearance -> "Labeled"}, {{c2, 0, "Dephasing"}, 0, 3, 
  Appearance -> "Labeled"}, {{c3, 0, "Spont. Emission"}, 0, 10, 
  Appearance -> "Labeled"}]

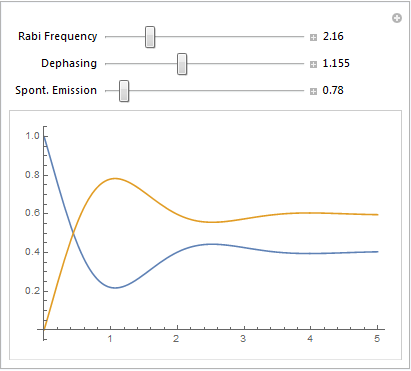
However, while the code does run (and gives the correct solution), I get this strange screen where I have a bunch of other stuff in the plot box: enter image description here

I'm not sure why this is happening, so my question is basically what is causing this unwanted stuff to be plotted. I tried looking for things like InterpolatingFunction inside figure, but no results popped up on that.

Oh, as a side note, these equations can also be solved with DSolve, but I want to make some adjustments that no longer allow that type of solution. I just used this because it is close to what I want, and I know what it looks like. Moreover, if there would be a way to make the plotting go faster, I'd also be interested in that.

$\endgroup$

3 Answers 3

2
$\begingroup$

The syntax is Manipulate[ expression1; expression2;....; expression10, controls] you had a Manipulate[ expression1, expression2, ..., expression10, controls], ie. used,` in middle of expression. Corrected.

Manipulate[
 solns = NDSolve[{
    ee'[t] == -I*c1/2*(ge[t] - eg[t]) - c2*ee[t],
    gg'[t] == I*c1/2*(ge[t] - eg[t]) + c2*ee[t],
    ge'[t] == -c2/2*ge[t] + I*c1/2*(gg[t] - ee[t]) - c3/2*ge[t],
    eg'[t] == -c2/2*eg[t] - I*c1/2*(gg[t] - ee[t]) - c3/2*eg[t],
    ee[0] == 1, gg[0] == 0, ge[0] == 0, eg[0] == 0}, {ee, gg, ge, eg}, {t, 0, 5}];
 Plot[{ee[t] /. solns, gg[t] /. solns}, {t, 0, 5}],
 {{c1, 0, "Rabi Frequency"}, 0, 10, Appearance -> "Labeled"},
 {{c2, 0, "Dephasing"}, 0, 3, Appearance -> "Labeled"}, {{c3, 0, "Spont. Emission"}, 0, 10, Appearance -> "Labeled"}
 ]

Mathematica graphics

$\endgroup$
3
  • $\begingroup$ Well, that's embarassing. It's my first time working with Mathematica, so I apologize for the beginners mistake. Thanks a lot! $\endgroup$
    – user129412
    Commented Jan 29, 2015 at 19:14
  • $\begingroup$ I should note (for clarity) that the proper syntax for Manipulate is: Manipulate[expr, 'controls'], where 'controls' can take various forms (like lists, Control[XXX], etc...). Arguments in WL are separated by commas, and the first argument to Manipulate is the expression to be manipulated. The problem in the OP was that the first argument was actually NDSolve[XXX] and not the CompoundExpression they actually wanted. $\endgroup$
    – chuy
    Commented Jan 29, 2015 at 21:56
  • $\begingroup$ @chuy Yes, of course, I meant to write Manipulate[expr1;expr2, controls] the OP had Manipulate[expr1,expr2, controls] will correct. thank you. $\endgroup$
    – Nasser
    Commented Jan 30, 2015 at 2:37
3
$\begingroup$

You could also try something like the following where I use ParametricNDSolveValue (what a mouthful!):

solns = ParametricNDSolveValue[{ee'[t] == -I*c1/2*(ge[t] - eg[t]) - 
     c2*ee[t], gg'[t] == I*c1/2*(ge[t] - eg[t]) + c2*ee[t], 
   ge'[t] == -c2/2*ge[t] + I*c1/2*(gg[t] - ee[t]) - c3/2*ge[t], 
   eg'[t] == -c2/2*eg[t] - I*c1/2*(gg[t] - ee[t]) - c3/2*eg[t], 
   ee[0] == 1, gg[0] == 0, ge[0] == 0, eg[0] == 0}, {ee, gg}, {t, 0, 
   5}, {c1, c2, c3}]

I see you only wanted ee and gg to plot so I used those. The result is a ParametricFunction, which can be rather nicely used in a Manipulate. I think it is also worthwhile to take a quick glance at what solns is by feeding it some parameters (here c1=1, c2=2, and c3=3):

solns[1, 2, 3]
(* {InterpolatingFunction[{{0., 5.}}, <>], 
 InterpolatingFunction[{{0., 5.}}, <>]} *)

So it's a List of InterpolatingFunctions. Moving on to the Manipulate

Manipulate[
 Plot[Evaluate@Through[solns[c1, c2, c3][t]], {t, 0, 5}], {{c1, 0, 
   "Rabi Frequency"}, 0, 10, 
  Appearance -> "Labeled"}, {{c2, 0, "Dephasing"}, 0, 3, 
  Appearance -> "Labeled"}, {{c3, 0, "Spont. Emission"}, 0, 10, 
  Appearance -> "Labeled"}]

I used Through and Evaluate to 1) apply the list of interpolation functions to the same argument, t, and 2) to allow Plot to "see" that the first argument I am giving it is actually a List and not a mulivalued function (this makes the lines different colors).

I also like this because it makes it clearer as to what expression is being manipulated. In this case it is Plot[Evaluate@Through[solns[c1, c2, c3][t]], {t, 0, 5}].

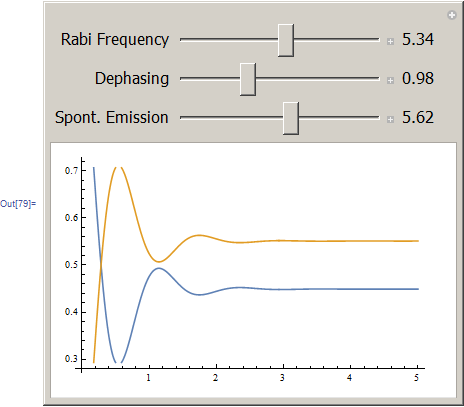
enter image description here

$\endgroup$
1
$\begingroup$

Put a semicolon immediately before Plot, instead of a comma.

$\endgroup$

Your Answer

By clicking “Post Your Answer”, you agree to our terms of service and acknowledge you have read our privacy policy.

Not the answer you're looking for? Browse other questions tagged or ask your own question.