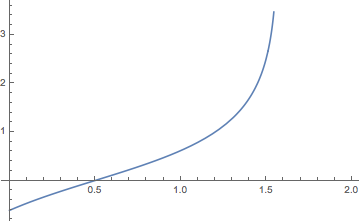
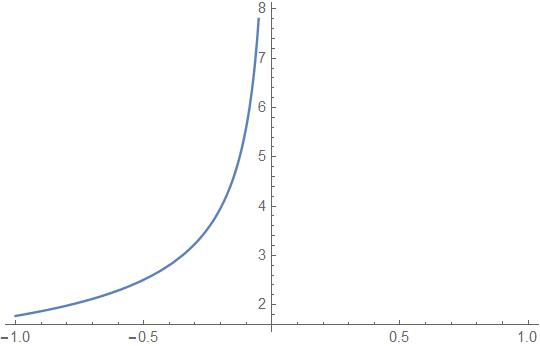
I'm plotting a function that I get after numerically integrating over another function. Something like:
f[x_,y_]:=NIntegrate[g[x,y,z],{z,0,1}]
I know that above some threshold value for $x$, the integrand in the expression diverges and the function is not defined anymore. I also know that this threshold value varies depending on the value of $y$. However, I don't know exactly what this threshold value is (i.e. I don't have an analytic expression for it).
Now I want to plot this function as a function of $x$ for several different $y$. However, for a given plotting range (for example, $x \in [0,1]$), the plot becomes ugly if this threshold point happens to be in this region since NIntegrate produces just gibberish after this point.
How do I tell Mathematica to stop plotting (and, for example, set the value of function to zero) when this point is reached? In other words, I'm looking for some way to tell the plotting function: "plot this function in this parameter region, but if the value of this function is outside this range of accepted values, then stop plotting."


