5
$\begingroup$

I am plotting polar curves with PolarPlot and I tried plotting a parabola with $\frac{2}{1-\cos x}$ and $\sec x$.

Obviously there are two singularities that have to be considered, $\cos x=1$ and $\cos x=0$. I dont know how to specify multiple singularities for the same function or variable. This is what I have tried so far:

PolarPlot[{2/(1 - Cos[x]), Sec[x]}, {x, 0, 2 \[Pi]}, 
 Exclusions -> {Cos[x] == 0, 1}]

PolarPlot[{2/(1 - Cos[x]), Sec[x]}, {x, 0, 2 \[Pi]}, 
 Exclusions -> {x == 0, 2 \[Pi], \[Pi]/2, (3 \[Pi])/2}]

PolarPlot[{2/(1 - Cos[x]), Sec[x]}, {x, 0, 2 \[Pi]}, 
 Exclusions -> {Cos[x] == 0, Cos[x]==1}]

What is the right way to do this?

Any help appreciated. Thank you.

$\endgroup$
3
  • $\begingroup$ You could just specify a PlotRange: i.sstatic.net/VvfsJ.png $\endgroup$
    – user484
    Commented Nov 19, 2014 at 15:07
  • $\begingroup$ @RahulNarain but in your image too there are errors how can i rectify them...?? $\endgroup$
    – Shobhit
    Commented Nov 19, 2014 at 15:11
  • $\begingroup$ @RahulNarain how to put the exclusions, that would achieve the same ? $\endgroup$
    – Shobhit
    Commented Nov 19, 2014 at 15:12

4 Answers 4

4
$\begingroup$

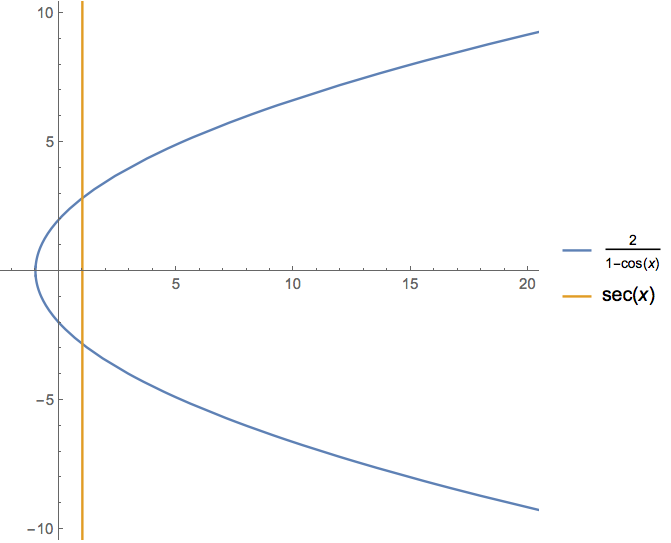
I would have expected your last form to work. Avoid the issue by putting the exclusion points {-Pi/2, 3Pi/2} at the boundaries of the iterator.

PolarPlot[{2/(1 - Cos[x]), Sec[x]},
 {x, -Pi/2, 3 Pi/2},
 AspectRatio -> 1,
 PlotRange -> {{-2, 20}, {-10, 10}},
 PlotLegends -> "Expressions"]

enter image description here

EDIT: Supposition about behavior of Exclusions -> Automatic.

$PerformanceGoal

"Quality"

From the documentation for Exclusions: "Exclusions -> Automatic is effectively equivalent to Exclusions -> True if $PerformanceGoal is 'Quality', and to Exclusions -> None otherwise. Exclusions -> True excludes all subregions where discontinuities are found in functions being plotted." For the function 2/(1 - Cos[x]) the discontinuities are easy to detect; however, the discontinuities in Sec[x] are apparently too subtle for whatever algorithm is used and are overlooked unless they are at the iterator boundaries. Presumably, the functions are evaluated at the iterator boundaries and when the singularities of Sec[x] are at the boundaries, they are discovered and excluded.

$\endgroup$
4
  • $\begingroup$ thank u for your solution very helpful $\endgroup$
    – Shobhit
    Commented Nov 19, 2014 at 17:42
  • $\begingroup$ Why is it that if we put exclusion points at the ends the function misbehaves ? $\endgroup$
    – Shobhit
    Commented Nov 19, 2014 at 17:43
  • $\begingroup$ See edit above. $\endgroup$
    – Bob Hanlon
    Commented Nov 19, 2014 at 20:10
  • $\begingroup$ Thank you, for clearing that up. $\endgroup$
    – Shobhit
    Commented Nov 20, 2014 at 13:34
4
$\begingroup$

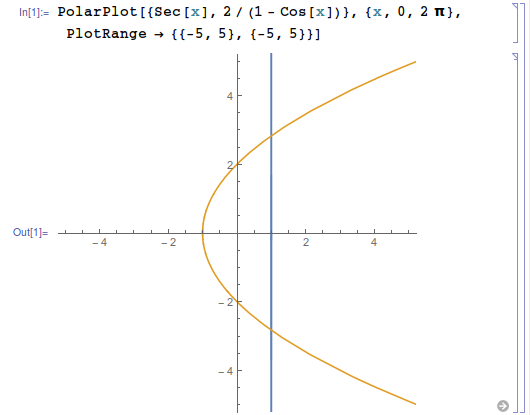
Interestingly enough, there are no errors if you change the order of the two functions, and it doesn't seem to require any explicit exclusions:

PolarPlot[{Sec[x], 2/(1 - Cos[x])}, {x, 0, 2 \[Pi]}, 
 PlotRange -> {{-5, 5}, {-5, 5}}]

evaluated plot

As Rahul Narain suggested, I also added a plot range.

$\endgroup$
3
$\begingroup$

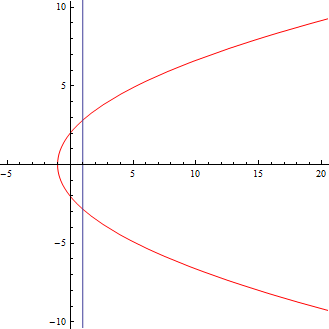
my best effort at that plot, manually clipping the angle range:

 Show[{
      PolarPlot[ 2/(1 - Cos[x]), {x, .1, 2 Pi - .1} ,
         AspectRatio -> 1 , PlotStyle -> Red  ],
      PolarPlot[Sec[x], {x, 0, 2 Pi} , AspectRatio -> 1 ]},
         PlotRange -> {{-5, 20}, {-10, 10}}]

enter image description here

after playing with this a bit I've concluded PolarPlot is simply badly behaved regarding Exclusion and even PlotRange options.

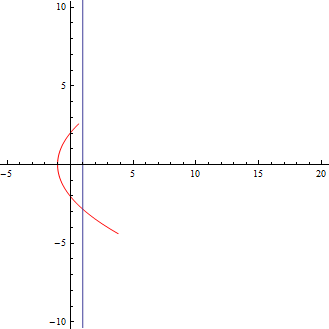
If we make that first range {0,2 Pi} the curve disappears all together, unless we specify some large number for PlotPoints :

 Show[{
     PolarPlot[ 2/(1 - Cos[x]), {x, 0, 2 Pi} ,
      AspectRatio -> 1 , PlotStyle -> Red  , PlotPoints -> 2000],
     PolarPlot[Sec[x], {x, 0, 2 Pi} , AspectRatio -> 1 ]}, 
          PlotRange -> {{-5, 20}, {-10, 10}}]

enter image description here

The curve fills in if you make PlotPoints even larger..not a very satisfactory solution though.

$\endgroup$
0
1
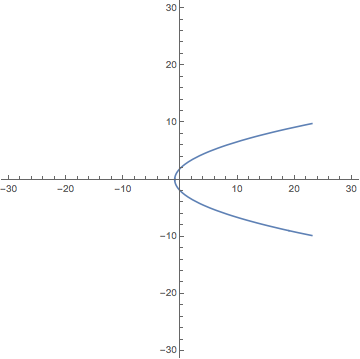
$\begingroup$

The RegionFunction option allows you to parametrically define what portion of the function to plot

PolarPlot[2/(1 - Cos[x]), {x, 0, 2 \[Pi]}, AspectRatio -> 1, 
 PlotRange -> 30 {{-1, 1}, {-1, 1}}, 
 RegionFunction -> Function[{x, y, \[Theta], r}, r <= 25]]

output graphics

$\endgroup$

Your Answer

By clicking “Post Your Answer”, you agree to our terms of service and acknowledge you have read our privacy policy.

Not the answer you're looking for? Browse other questions tagged or ask your own question.