38
$\begingroup$

I've written my incredibly complex, incredibly elegant analysis function, that works great on small test data. But when I run it on my real (bigger) data set it keeps running out of memory. It turns out that the analysis function does not free memory, but I can't imagine why. It takes a large number of points, but returns only several scalar values.
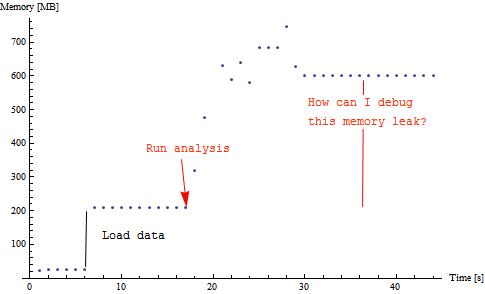
memory usage after time

Every time I run this it takes up about 500 MB of memory. (here is another example).

What is the best way to debug memory problems?

I've read the memory management tutorial, turned off caching and verified I have no lingering variables in my contexts and of course I have set $HistoryLength to zero.

Also running Reverse@Sort[{ByteCount[Symbol[#]], #} & /@ Names["`*"]] show no huge memory symbols. Just the data:

{{191816648, "alldata"}, {28184, "before"}, {28184, "after"},
 {24096, "compiledSelectBin"}, {15344, "AppendLeftRight"}, {8840, "compiledSelectBinFunc"}...}

EDIT One can use this code to track memory consumption:

DynamicModule[{pm = {}},
 Dynamic@Refresh[pm = Append[pm, MemoryInUse[]]; 
   If[Length[pm] > 120, pm = Drop[pm, 1]]; 
   ListPlot[pm/1024/1024, AxesLabel -> {"Time [s]", "Memory [MB]"}, 
    PlotRange -> {0, All}], UpdateInterval -> 1, 
   TrackedSymbols :> {}]]

I think I finally have a minimum example. Here it is. Unzip to a folder and evaluate the two cells in LeakP.nb. If you evaluate the second cell multiple times you can watch the memory consumption grow. Could somebody (on win7 64 bit mma 8) confirm this?

EDIT 1

I really hope I have nailed it down. Here is a self contained example:

$HistoryLength = 0;
data = RandomReal[{-1, 1}, {10, 100000, 2}];
data = Developer`ToPackedArray[#] & /@ data;
data = Flatten[data, 1];
Dimensions[data]
HistogramList[data, 30, Automatic];
ClearAll[data]; ClearSystemCache[];

EDIT 2

This is fixed in Mathematica 9.0.0.

$\endgroup$
29
  • 2
    $\begingroup$ the question you ask is impossible to answer in any non speculative way without seeing the code. Having said that and assuming for a second that you did follow the typical suggestions have you tried to explicitly set all variables in your Module/Block to Null right after they are not used any longer? $\endgroup$
    – user21
    Commented May 29, 2012 at 10:28
  • 1
    $\begingroup$ @rubenko No, not yet. Also, I'm not asking where is my problem, I'm asking how to start tracking it down. (Aha, the question in the image is rhetorical:) This is a largish piece of code (about 600 lines) and I'm at a loss where to begin... $\endgroup$
    – Ajasja
    Commented May 29, 2012 at 10:32
  • 2
    $\begingroup$ Perhaps it's time to try constructing a minimal working example and share it. If the mistake is indeed in your code (and it's not a bug in some Mathematica function you're using), it would be very worthwhile to learn about it, for all of us. (If you post a working example: please note that some of us only have 2 GB of memory, so scale it down a bit :) $\endgroup$
    – Szabolcs
    Commented May 29, 2012 at 12:03
  • 6
    $\begingroup$ Note that ByteCount[sym] will only show the memory used by the OwnValues for the symbol. I introduced the symbolMemoryUsage function in my answer specifically to address other global properties as well. $\endgroup$ Commented May 29, 2012 at 13:23
  • 1
    $\begingroup$ I think @acl gave a very sound suggestion: try to refactor your code so that it is built from really small functions and use as little state as possible. It should then be much easier to locate the place where leak is happening. $\endgroup$ Commented May 30, 2012 at 10:12

2 Answers 2

38
$\begingroup$

Preamble

It is hard to say what exactly is causing this without seeing the code, but, assuming that there are no memory leaks in the built-in functions you are using, I am only aware of a very few possible causes for memory leaks in Mathematica. Since almost anything is immutable, the leaks must be associated with some symbols for which definitions are accumulated but not cleared.

I will show here one rather obscure case of leaking of local Module variables, which happens when the variable is referenced by some object / symbol, external w.r.t. its scope. In such cases, such variables are not garbage-collected even after the symbols referencing them get Remove-d, in case if they get assigned DownValues, SubValues or UpValues (OwnValues are ok).

One subtle case with a memory leak

MemoryInUse[]
 17350016
$HistoryLength = 0;

Module[{g},
  Module[{f},
    g[x_] := f[x];
    Do[f[i] = Range[i], {i, 5000}];
  ];
  g[1]]
 {1}
MemoryInUse[]
 72351376

One way to ensure that this does not happen is to insert Clear[f] at the end of the outer Module, storing the result in a separate variable and returning it afterwards. There are more advanced ways to prevent such things as well. I may elaborate on those at some later time.

Memory leaks associated with UI-building

One common cause of memory leaks which is often ovelooked is when some local symbols make it into UI elements. The problem is that UI elements are Mathematica expressions, which do reference those symbols, and therefore, they are not garbage-collected.

Here is an example I borrowed from this thread

memModule[] := 
  Module[{data, memBefore, mu}, 
     mu := Grid[{{"Memory in use: ", MemoryInUse[]/(2^30.), "GB"}}]; 
     memBefore = mu; 
     data = RandomReal[1, {300000, 20}]; 
     DynamicModule[{d1}, 
        d1 := data[[1]]; 
        Panel[Grid[{{memBefore}, {mu}}]] 
       , UnsavedVariables -> {dl} 
    ] 
 ]; 

Now, every time when it gets executed, more memory is being leaked:

memModule[] 
memModule[] 
memModule[] 

Please see my answer in the linked thread for one way out, in this particular case. Generally, this is something to watch out for.

Monitoring symbols

So, one good place to start is to call

Names["Global`*"]
 {"f", "f$", "f$119", "g", "i", "x", "x$"}

or whatever main context you are using (or other contexts, if you create symbols there), and watch for some symbols with high memory usage. In this particular case, the culprit it f$119.

Here are some utility functions which may help with monitoring symbols:

Clear[$globalProperties];
$globalProperties =
    {OwnValues, DownValues, SubValues, UpValues, NValues, 
     FormatValues, Options, DefaultValues, Attributes, Messages};

ClearAll[getDefinitions];
SetAttributes[getDefinitions, HoldAllComplete];
getDefinitions[s_Symbol] :=
    Flatten@Through[
        Map[
           Function[
              prop, 
              (* Unevaluated needed here just for Options, which is not holding *)
              Function[sym, prop[Unevaluated @ sym], HoldAll]
           ],
           $globalProperties
        ][Unevaluated[s]]
      ];

ClearAll[symbolMemoryUsage];
symbolMemoryUsage[sname_String] :=
   ToExpression[sname, InputForm, 
      Function[s, ByteCount[getDefinitions[s]], HoldAllComplete]
   ];

ClearAll[heavySymbols];
heavySymbols[context_, sizeLim_: 10^6] :=
   Pick[#, UnitStep[# - sizeLim] &@Map[symbolMemoryUsage, #], 1] &@
        Names[context <> "*"];

For example, calling

heavySymbols["Global`"]

returns

 {f$119}
$\endgroup$
24
  • $\begingroup$ +1 Thank you for the example. Now I understand the comment you made here. Unfortunately, there appear to be no heavy symbols. heavySymbols[""], returns {"alldata", "GeoProjectionData"} which is that data I loaded at the beginning and an always present built-in. $\endgroup$
    – Ajasja
    Commented May 29, 2012 at 11:55
  • $\begingroup$ @Ajasja Well, then I am at a loss. Do you create symbols in other contexts? Or, do you return any expression involving local variables, or embed it into UI, for example? UI-s are another cause of memory leaks, see e.g. my answer in this thread $\endgroup$ Commented May 29, 2012 at 12:00
  • 1
    $\begingroup$ @Ajasja I also had a situation with the kernel eating up gigabytes of memory, linearly increasing in time even though I never kept more than 1GB of data in symbols. I also had checked and no symbols had anywhere near the memory consumed. in the end I rewrote my program in a completely different way and now it doesn't eat memory. have no clue what it was. $\endgroup$
    – acl
    Commented May 29, 2012 at 12:13
  • $\begingroup$ @LeonidShifrin I don't create symbols in any other context. What I'm doing a lot is assigning to the same Module variable multiple times. For example data=rawdata; data=GetDiffrences[data]; data=Mean[data]... Return[data] But I belive this shuld be safe. I'm putting memory print statements all over my code as we speak... $\endgroup$
    – Ajasja
    Commented May 29, 2012 at 12:14
  • 1
    $\begingroup$ @Kvothe There was indeed an evaluation leak coming from Options not holding its argument - which would show up for symbols with OwnValues, such as e.g. a := Print["***"] - then calling getDefinitions on a would lead to printing. I have made and edit that should fix it, check it out. Regarding parallel, it looks like you already found an answer. $\endgroup$ Commented Jun 18, 2021 at 9:48
15
$\begingroup$

This is a memory leak in HistogramList:

You can reclaim the memory by evaluating

Remove["*`*modelData$*"]
$\endgroup$
2
  • 1
    $\begingroup$ Using the previous answer with heavySymbols["*`"] allows to find this. Great case study ! $\endgroup$
    – faysou
    Commented May 30, 2012 at 21:12
  • 1
    $\begingroup$ Isn't Remove["System`HistogramListDump`modelData$*"] safer? $\endgroup$
    – Ajasja
    Commented May 31, 2012 at 8:16

Your Answer

By clicking “Post Your Answer”, you agree to our terms of service and acknowledge you have read our privacy policy.

Not the answer you're looking for? Browse other questions tagged or ask your own question.