4
$\begingroup$

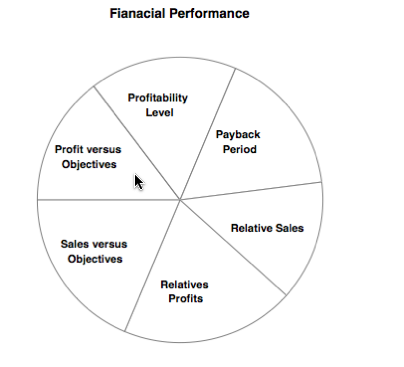
In my pie chart, it's almost there.

Can I wrap some words?

like putting "Profit versus Objectives" t0 three lines,

but still in the right sector.

PieChart[{1/6 - 0.02, 1/6, 1/6, 1/6 - 0.03, 1/6 + 0.03, 1/6 + 0.02}, 
ChartLabels -> {"Profit versus Objectives", "Profitability Level", 
"Payback Period", "Relative Sales", "Relatives Profits", 
"Sales versus Objectives"}, ChartStyle -> {White}, 
PlotLabel -> "Fianacial Performance", 
BaseStyle -> {FontWeight -> "Bold", FontSize -> 11, 
FontFamily -> "Helvetica"}]

Many thanks!

$\endgroup$
5
  • 2
    $\begingroup$ Use ChartStyle -> White and LabelStyle -> (FontSize -> 24) or LabelStyle ->24? $\endgroup$
    – kglr
    Commented May 14, 2014 at 21:24
  • $\begingroup$ Thanks, just figured it out. Is it possible to wrap the words a bit? $\endgroup$ Commented May 14, 2014 at 21:48
  • 1
    $\begingroup$ Try using \n inside the quotes. Does this wrap as you wish? $\endgroup$
    – bill s
    Commented May 14, 2014 at 21:58
  • 1
    $\begingroup$ "Profit\nversus\nObjectives" in place of "Profit versus Objectives" seems to do it. $\endgroup$
    – m_goldberg
    Commented May 14, 2014 at 22:00
  • $\begingroup$ You can also use ChartLabels->Pane[#, 70] & /@ { ...labels...} or ChartLabels->Row[{#}, 70] & /@ { ...labels...} $\endgroup$
    – kglr
    Commented May 14, 2014 at 22:28

2 Answers 2

4
$\begingroup$

Wrapping labels in Pane often helps in charts:

labels = Pane[#, ImageSize -> 80] & /@ {"Profit versus Objectives", 
    "Profitability Level", "Payback Period", "Relative Sales", 
    "Relatives Profits", "Sales versus Objectives"};

PieChart[{1/6 - 0.02, 1/6, 1/6, 1/6 - 0.03, 1/6 + 0.03, 1/6 + 0.02}, 
 ChartLabels -> labels, ChartStyle -> {White}, 
 PlotLabel -> "Fianacial Performance", 
 BaseStyle -> {FontWeight -> "Bold", FontSize -> 11, 
   FontFamily -> "Helvetica"}]

enter image description here

The benefit of using something like Pane is that you can make all labels the same image size and do not have to worry about manually placing line breaks.

$\endgroup$
2
$\begingroup$

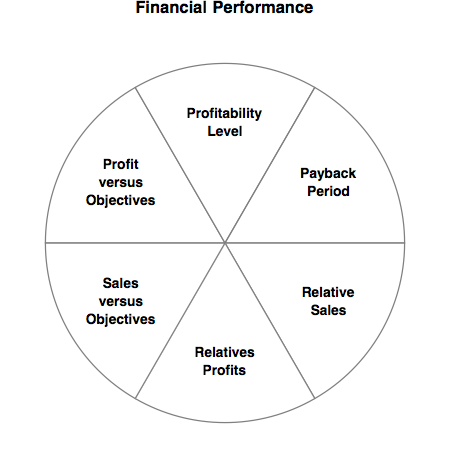
Using newline ("\n") as the delimiter in the labels rather than space (" ") seems to produce a good-looking pie chart.

PieChart[ConstantArray[1/6, 6], 
  ChartLabels -> {
    "Profit\nversus\nObjectives", "Profitability\nLevel", "Payback\nPeriod", 
    "Relative\nSales", "Relatives\nProfits", "Sales\nversus\nObjectives"}, 
  ChartStyle -> {White}, 
  PlotLabel -> "Financial Performance", 
  BaseStyle -> {FontWeight -> "Bold", FontSize -> 11, FontFamily -> "Helvetica"}]

pie.png

$\endgroup$

Your Answer

By clicking “Post Your Answer”, you agree to our terms of service and acknowledge you have read our privacy policy.

Not the answer you're looking for? Browse other questions tagged or ask your own question.