added 159 characters in body
Source Link
Mike Honeychurch
  • 37.8k
  • 3
  • 87
  • 161

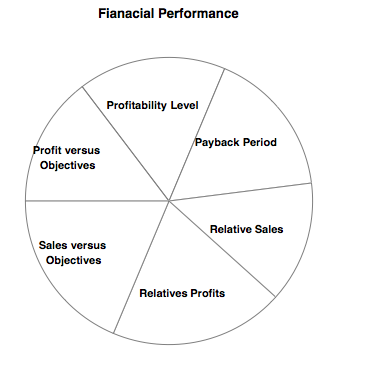
Wrapping labels in Pane often helps in charts:

labels = Pane[#, ImageSize -> 100]80] & /@ {"Profit versus Objectives", 
    "Profitability Level", "Payback Period", "Relative Sales", 
    "Relatives Profits", "Sales versus Objectives"};

PieChart[{1/6 - 0.02, 1/6, 1/6, 1/6 - 0.03, 1/6 + 0.03, 1/6 + 0.02}, 
 ChartLabels -> labels, ChartStyle -> {White}, 
 PlotLabel -> "Fianacial Performance", 
 BaseStyle -> {FontWeight -> "Bold", FontSize -> 11, 
   FontFamily -> "Helvetica"}]
enter image description hereenter image description here

The benefit of using something like Pane is that you can make all labels the same image size and do not have to worry about manually placing line breaks.

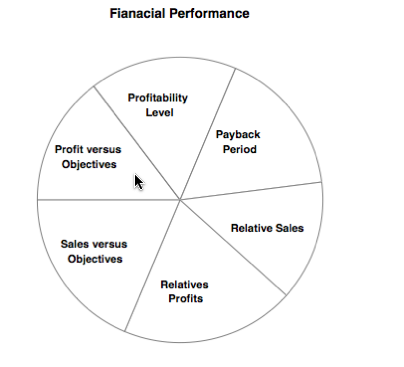
Wrapping labels in Pane often helps in charts:

labels = Pane[#, ImageSize -> 100] & /@ {"Profit versus Objectives", 
    "Profitability Level", "Payback Period", "Relative Sales", 
    "Relatives Profits", "Sales versus Objectives"};

PieChart[{1/6 - 0.02, 1/6, 1/6, 1/6 - 0.03, 1/6 + 0.03, 1/6 + 0.02}, 
 ChartLabels -> labels, ChartStyle -> {White}, 
 PlotLabel -> "Fianacial Performance", 
 BaseStyle -> {FontWeight -> "Bold", FontSize -> 11, 
   FontFamily -> "Helvetica"}]
enter image description here

Wrapping labels in Pane often helps in charts:

labels = Pane[#, ImageSize -> 80] & /@ {"Profit versus Objectives", 
    "Profitability Level", "Payback Period", "Relative Sales", 
    "Relatives Profits", "Sales versus Objectives"};

PieChart[{1/6 - 0.02, 1/6, 1/6, 1/6 - 0.03, 1/6 + 0.03, 1/6 + 0.02}, 
 ChartLabels -> labels, ChartStyle -> {White}, 
 PlotLabel -> "Fianacial Performance", 
 BaseStyle -> {FontWeight -> "Bold", FontSize -> 11, 
   FontFamily -> "Helvetica"}]

enter image description here

The benefit of using something like Pane is that you can make all labels the same image size and do not have to worry about manually placing line breaks.

Source Link
Mike Honeychurch
  • 37.8k
  • 3
  • 87
  • 161

Wrapping labels in Pane often helps in charts:

labels = Pane[#, ImageSize -> 100] & /@ {"Profit versus Objectives", 
    "Profitability Level", "Payback Period", "Relative Sales", 
    "Relatives Profits", "Sales versus Objectives"};

PieChart[{1/6 - 0.02, 1/6, 1/6, 1/6 - 0.03, 1/6 + 0.03, 1/6 + 0.02}, 
 ChartLabels -> labels, ChartStyle -> {White}, 
 PlotLabel -> "Fianacial Performance", 
 BaseStyle -> {FontWeight -> "Bold", FontSize -> 11, 
   FontFamily -> "Helvetica"}]

enter image description here